April and May 2019 Ferry Traffic

Compiled by Diana Mumford with coaching from Brian Hollingshead

Hi Everyone:

Brian has passed on his task of preparing the monthly ferry traffic stats to me. Luckily he is a very patient man who has provided me with lots of instructions and one-on-one lessons. Please blame errors on the ‘student’ and not the instructor! The commentary he usually provided will be much more brief and general as I still need practice in telling the tales of ferry life! Please also remember that I will be seeing all of this through a different lens as my ferry travel route is different than Brian’s.

The reason for the long gap between March and May stats is that BC Ferries did not release the April traffic information until they released the May info. April_2019_Traffic_StatsMay_2019_Traffic_Stats

As such the May YTD graphs are shown below.

As you can see from the graphs the traffic levels continue to increase for the Northern and Minor routes, while the Majors and route 3 go the other direction. Some of that decrease in majors and route 3 could be the split in holidays for spring break and Easter, but I would also guess that the move to the shoulder schedules is a contributing factor. The ferry service provided is causing significant overloads with residents and travellers left waiting on the ferry parking lot hot tarmac for hours.

Capture1

Capture2

Capture3

Capture4

Capture5

Capture6

Capture7

The overall increase in ferry traffic through the system in comparison to last May is 0.07% for passengers and 1.41% for vehicles. This number would be very different if the 20+% increase for the two routes of 9 (Southern Gulf Islands) and 10 (Port Hardy to Prince Rupert Inside Passage) were not included.

Capture8

Please let me know if this information is beneficial and if anything is missing for you.

Happy Long Weekend!!

Diana Mumford Co-Chair

Ferry Advisory Committee Chairs

March 2019 Ferry Traffic

Compiled and written by Brian Hollingshead

FAC Chairs

’Twas a very good month (at least for the Minors and the Northern Routes). March_2019_Traffic_Stats  For the Majors, only slightly better than their anaemic year to date performance.   The Minors realized growth on all routes, with several in excess of 6%.  Overall, the Minors vehicles were up 5.13% and passengers up 4.51%. Graph 1.  The Majors, vehicles up 1.41%, passengers up 0.77%.  Both groups managed to exceed their year to date growth rates.  Bottom line, System traffic was up over last March by 2.59% and 2.58%, vehicles and passengers respectively.

Capture1

March is the last month where fears of traffic collapse and/or hopes for miraculous recovery screech to a halt.  The fiscal year is over and done.  System vehicle traffic, fuelled by the Minors, increased 1.87% and passengers, 1.16% over FY2018.  Graph 2.  This is slightly less than the 2.6% and 1.6% anticipated by BCF,  but not that far off, considering how early that forecast was created and built into the PT5 application.  The miserable February weather was an unexpected drag on the average.

Capture2

Looking at March traffic over the past nine years, including the various bits of Easter weekends and Spring breaks that occurred through the period (Graph 3), the upward trend since the depths of 2014 continues, if slightly slowed.  Given the variables in March weather and out-of-school times, the trend is solid.  Minor fluctuations in the rate of growth from year to year are not a concern.

Capture3

The Minor Route March history (Graph 4) is similar to the System picture, except the March 2014 ditch was deeper and the recovery stronger.  As has been the case all year, the Minor Routes were the traffic growth leaders, likely due in large part to the 15% fare cut and restoration of free BC seniors’ Mon to Thurs travel.  Major routes, including Route 3 (Graph 5), much less robust traffic increase.

Capture4

Capture5

Graph 6 frames the fiscal year.  Traffic dropped off from the high expectations created last year, beginning in May and continuing through the smoky summer, the money making season.  Couple of shoot-out-the-lights months, Nov and Jan, but unfortunately happening when traffic is at its lowest.  And then February the Horrible.  An OK year, if a little disappointing stacked against the previous three years.

Capture6

Graph 7 illustrates the overall years’ traffic changes compared to FY2004, the year of the shift to the current model.  The final numbers, 8% and 4% relative growth, are down slightly from the 9% and 5% projected with the BCF forecast.  Close enough for forecasting.  Passenger growth is a final now.  The vehicle growth is an estimated AEQ growth, based on actual year to date traffic count.  Final AEQ count will be available in July.  Still well under the modest 1% growth that was throttled for the first 10 years.  But heading slowly toward recovery.  Lot of ideological throttling going on in those early years.

Capture7

And finally, the long look, (Graph 8) where we see vehicle traffic greater than it’s ever been, and passenger traffic approaching that point.  Anybody tells you traffic is big picture cyclical, don’t you be believing them.  It isn’t.  It grows with population and the financial well-being of the area.  It collapses when ideologues take a wrecking ball to fares and/or service.  It recovers when someone eventually takes away the wrecking ball.

Capture8

Perspectives on the ‘bare numbers’ . . .

– For BCF, booming traffic means booming revenue, perhaps more money to invest in new ferries, terminal facilities, IT systems and other bits.  Also, more stress on the system.

– For the customers, improved traffic reflects and supports healthier communities.  Beyond a certain point, it means more and longer sailing waits, and it becomes a choke on tourism and local businesses.  BCF and gov’t attention is required to plan, to the extent possible, sufficient capacity and flexibility to reasonably meet the demand.  There are wrinkles but it’s not rocket science.

– For the gov’t, it means healthier communities and happier voters, provided there is sufficient ongoing funding to support fares seen to be ‘affordable’ and fare increases seen to be ‘fair’, along with sufficient investment to support right-sizing the fleet as needed.  The Macatee Report and most recently, the Redlin Report have been instrumental in bringing some much needed customer focused sanity to the Draconian thinking that came with the original restructuring in 2004.

It’s vital this customer- and community-focused orientation not be taken for granted.  The Hungry Dollar never sleeps.  Whatever the new Super Advisory crew turns out to be, the Ferry Advisory Committees are and will remain the groups closest to the coastal communities.  The ferry service is their lifeline.  And you are their voice.

The future?  I’ll leave that to others who will be around to answer for their unfulfilled shots in the dark.

This is my last traffic report.  This gig has been blast, and now it’s on to other things.  Give your support to Diana and Keith when they ask for it; they can’t do the job in a vacuum.

Comment, questions, suggestions?  Too late.  Save them for the next gen.

Cheers,

Brian

February 2019 Ferry Traffic

Written by Brian Hollingshead

FAC Chairs

‘Brutal’ probably best describes February ferry traffic.  Vehicle traffic down 5.78%, passenger traffic down 6.16%, compared to Feb 2018.   February_2019_Traffic_Stats  Substantial traffic losses on almost every route.  Graph 1.  The Northern routes, apparently bucking the trend, only did so as a result of gains on Rte 11 offsetting the losses on Rte 10.  As shyly predicted last month the ‘brutal’ (for coastal BC) weather was almost totally to blame for the traffic hit.

Capture1

Graph 2 reassures us there will still be a modest traffic increase when the year closes in another month. However the Feb losses have dialled back the anticipated gains by about half a percent from last month’s look.

Capture2

Graphs 3, 4 and 5 compare Feb traffic for Februarys back to 2010, when we first started receiving this data.  No surprise, this Feb is substantially lower than last Feb.  The large gap between vehicle and passenger traffic for the system and for Rte 3, as explained last year, is due to the 2010 Winter Olympics.  That was the year the whole province was invited to come to the Lower Mainland to join in the fun, BUT do not even think about bringing your car into Nightmare Alley Vancouver traffic.  So vehicle traffic dropped substantially on the Majors, including Rte 3, while passenger traffic exploded.  And that abnormal traffic became the base for succeeding Februarys.  Aside from being the first year the data was available, there’s nothing sacred about 2010.  If 2011 or some later year is used as the base year in future, the vehicle and passenger traffic will track more closely.  The Minor routes were only minimally affected by the Olympic drama and thus, their passenger and vehicle traffic tracked quite closely.

Capture3

Capture4

Capture5

It’s been a depressing traffic (and revenue) year, compared to the heady experience of the previous fiscal year.  Graph 6.  Three good months.  Six middling months and then, ouch!, this February.  Not to dwell on the subject, but March doesn’t hold out a lot of hope for improvement, in that it will lack half an Easter weekend it enjoyed last year.  Happily, the weather seems to have now turned the corner, two thirds of the way through the month.

Capture6

Graphs 7 and 8 provide long and longer term looks at traffic, with the years of famine followed by the past four years of plenty.  The roughed in numbers for fiscal year 2019 are as presented in the BCF submission for PT5 fare increase caps, last September.  As a result of an excess of unkind winter weather, it’s likely those numbers are going to prove to be a bit optimistic.  We’ll know better in a month.

Capture7

Capture8

Questions or comments, feel free.  Sort of.

Brian

Province Restoring Ferry Service to some Coastal Communities

During a conference call with Ministry of Transportation and Infrastructure Minister Claire Trevena on February 22nd FAC Chairs learned that government is increasing service on 10 ferry routes that were cut in 2014, restoring 2,700 round-trip sailings for people living in coastal communities. BC_Ferries_routes_backgrounder Feb 22

“For years people living in coastal communities saw ferry fares increase and services cut,” said Claire Trevena, Minister of Transportation and Infrastructure. “Quality, affordable ferry services are a necessity not a luxury for people in coastal communities. That’s why we’ve turned the ship around – first by rolling back ferry fares on small coastal routes and now by reversing cuts to services that were making it difficult for people to get around.”

The minister announced these service changes and released the Redlin report, 20180630-review-coastal-ferry-services a comprehensive operating review of the coastal ferry service that identifies opportunities to improve services under the current model.

The ministry has been working with BC Ferries to respond to the BC Ferry Advisory Committee chairs’ request to restore some services cut in 2014 and have reached an agreement to return these services over the next year with the majority starting as early as this spring.

“The Redlin report was very comprehensive with more than 60 recommendations directed to all parties working under the unique and complex coastal ferry governance model,” Trevena said of the document, written by Blair Redlin, special advisor. “One of his recommendations is to establish a long-term vision for ferries and to connect coastal communities in a more integrated manner. This is something my staff and I will be focused on.”

The Province will also be amending the Coastal Ferry Act to implement some of Redlin’s recommendations that will ensure the model is putting people first.

Last April, government improved ferry service by providing funding to BC Ferries to reduce fares on the smaller and northern routes by 15%, freeze fares on the major routes and reinstate the Monday – Thursday 100% discount for seniors’ passenger fares. Fares will continue to be frozen this year.

Learn More:

Link to the Redlin report: https://www2.gov.bc.ca/gov/content/transportation/transportation-reports-and-reference/reports-studies/ferries-marine/coastal-ferry-services-review

For a backgrounder on ferry routes, visit: https://news.gov.bc.ca/files/BC_Ferries_routes_backgrounder.pdf

January 2019 Ferry Traffic

Written by Brian Hollingshead

FAC Chairs

January was the banner month that’s been largely missing this past year.  January_2019_Traffic_Stats  Almost every route saw traffic growth.  System vehicle traffic was up 6.47%, with passenger traffic up 5.58%, over last January’s volume.  Graph 1.  However, it’s late in the fiscal year and January is one of the lowest volume months.  Thus, the hefty January increases barely moved the needle on the more modest year to date numbers in Graph 2 (vehicles up 2.32%, passengers up 1.5%).  As has been the case all year, the gains on the Minors substantially outstripped those on the Majors and Route 3.

Capture1

Capture2

This January, compared to previous Januarys, shows the now familiar trend of four years of steady improvement (Graphs 3, 4, 5) following five years of heart-ache.  What’s noteworthy is that the Minors, which were deeper in the ditch than the Majors (and the System) are now experiencing substantially greater gains than the System, above the base year (2010).  The 15% fare cut has to be one of the major contributing factors to the Minor’s robust growth.  The absence of a similar rebound on Rte 3 may be attributed to capacity limitations and on-time-performance issues.  Or even the perception of the existence of those negatives.

Capture3

Capture4

Capture5


Graph 6 illustrates a generally disappointing year.  While this January is cause for celebration, February, blessed with a full winter in just three weeks, will doubtless continue the saw tooth pattern.  The takeaway is that particularly hostile weather (snow, wind, smoke) can and will have an immediate and dramatic downward influence on traffic.

Capture6


And finally, Graphs 7 and 8 remind us that traffic has been increasing to unprecedented heights over the past four years, even though at a lesser rate this past year.  We’ve seen the stress this level of traffic has imposed on some routes, stretched to capacity with their existing vessels.  The Province’s recent announcement of the addition of 2700 previously cancelled round trip sailings is a welcome one.  It’s not clear if that number is in addition to, or includes, sailings already returned by BCF.  Regardless, the additional sailings, where added, will help to a minor degree to reduce the summer season overload crunch.  The real and necessary solution, however, is more and/or bigger boats, which. mercifully, are now at various points in the (metaphorical) pipeline.

Capture7

Capture8


The fare freeze for the coming year should, in the absence of major poor weather events or other external negative influences, result in a steady increase in traffic.   Not too hard to imagine, when comparing to the underperforming months this past year.  Further, the Province’s stated intent to try to keep fares within CPI range, while expanding service and undertaking major capital expenditures, bodes well for critical ferry service into PT5.

Questions or comments, don’t be shy.

Brian

ps In case you’re wondering, I’ve committed to continuing these traffic reports to the end of this fiscal year, though no longer a FAC member.  Two more left – b

December 2018 Ferry Traffic

Written by Brian Hollingshead

FAC Chairs,

Weather and autonomous vehicles shaped the ho-hum traffic results this December.  Vehicle traffic up just 0.6% while passenger traffic down 0.6%.  Unending rain topped off by brutal storms kept casual travelers at home. December_2018_Traffic_Stats

Check out Graph 1, particularly the Minors.  Substantial vehicle traffic increase but with passenger traffic losses.  The pattern is consistent through almost every Minor route as well as with Rte 30.  Invasion of the self-driving SUV’s?  Big drop in foot passengers?  ‘You can go if you feel you must, dear, but I’m not going with you’?  Typically, passenger traffic growth has lagged that of vehicles (Graph 2), but the magnitude of the gap this time is weird.  Safe to say, in any event, that the crappy weather was an overriding influence.

Capture1

Capture2

Consistent with observations through the year, the Minor routes outperformed the Majors, including Rte 3.  The assumption remains that the 15% fare cut on the Minors, but not on the Big Three Majors, explains most of the difference.  Rte 3, with the fare cut, but without the growth (this month and throughout the year), remains an anomaly.

While December is an iffy month – weather, holiday break, seasonal angst – the general trend (Graph 3) is a long climb, since 2012, out of the ditch.  This December, like December 2016, was a pause in the process.  Not likely a change in direction.

Capture3

The historic December Minor route traffic pattern (Graph 4) is similar to the System trend, except for the Self-Driving SUV Effect this month.  Note how typically, passenger traffic changes are in line with vehicle traffic changes.  But not this month.  Otherwise, the trend is consistent with Minor route performance through the year.

Capture4

Rte 3 historic December traffic (Graph 5) shows a similar pattern to the Minors – tough one in 2016, and a pause this December.  The difference, however, is that passenger traffic is aligned with vehicle traffic, as one would reasonably expect.

Capture5

Graph 6 tells a number of stories . . .

Capture6

traffic this December just slightly different than last December

– as suggested last month, November was truly an anomaly vs the rest of this fiscal year

– April appears to be an anomaly, but only because it lost half an Easter weekend vs April 2017

– fiscal 2018 finished off a record year in March, dramatically improving upon the previous year’s traffic, and then,

– traffic in fiscal 2019 has struggled all year for a variety of reasons, the exceptions being May and November.  The Majors have consistently performed below expectations, dragging down the System numbers

Nothing in this is news.  Just presented from a different angle.

The Minor Route daily traffic picture (Graph 7) illustrates the traffic growth every month, year after year, since 2014.  While there are summer peaks, the pattern is a year long one. As well is showing the year to year growth, it provides a month by month sense of the seasonal peaks and valleys.

Capture7

Capture8

Graph 9 shows the System traffic changes since 2004, the start of the current structure, vs a steady 1% increase.  The overall picture is familiar.  The projected 2019 numbers are based on BCF forecasts in the PT5 submission (2.6% vehicle increase and 1.6% passenger growth).  The current YTD growth numbers are 2.01%, vehicles, and 1.23%, passengers, suggesting the final numbers shown are likely a bit optimistic.  In the ballpark, but . . .   With January and February being low volume months and March missing half an Easter weekend it enjoyed last year, there isn’t much can happen to improve the YTD results.  To move the needle, as the politicians say.

Capture9

The Long Look reminds us that traffic, notwithstanding this year’s lame performance, is still at record levels for vehicles and almost record levels for passengers.  Again, the 2019 projected levels are based on the BCF forecast, and probably overstate what the actuals will be by the end of March.

Capture10

The overarching message from this graph is to expect more overloads, especially on some routes, in the coming summer and shoulder seasons.  This past year has been out of the norm, with the summer long smoke blanket and some goofy weather, discouraging traffic.  It could be the ‘alleged’ climate change is actually real and may be expected to deliver ongoing weather surprises, chilling ferry traffic.  That said, those lumps and bumps will be secondary to the fundamental drivers – population growth, tourism (political impacts), provincial GDP growth and reasonable fares.

It’s a crazy world out there these days, guys.  We can be grateful for the relative tranquility/predictability of our ferry service.  It ain’t perfect, but . . .

Questions, comments, rude suggestions . . . all welcome.

Brian

November 2018 Ferry Traffic

Written by Brian Hollingshead:

FACChairs,

A ‘Break-Out-The-Champagne’ month for traffic. November_2018_Traffic_Stats

All routes, with the exception of the enigmatic Rte 10, showing traffic gains, some of them substantial, vs Nov 2017.  System wide, vehicle traffic was up 6.67%, passenger traffic, up 5.99%, over November last year (Graph 1).

Capture1

A welcome improvement, particularly for the Majors, vs results through the year. As evident from Graph 2, the Majors have clung to what could most charitably be referred to as modest traffic increases since April.  This, while the Minors have demonstrated consistent robust growth.  The Northern/Central Coast routes‘ traffic numbers have been erratic, often with push/pull results between Rte 10 and Rte 11, presenting a misleading picture of any apparent trend.

Capture2

There have been times when apparently exceptional gains or losses have been caused more  by results in the base month, than current month numbers.  Graphs 3, 4 and 5 suggest this not to be the case this time.

Capture3Capture4

Capture5


Graph 6 reinforces the point.  November last year showed modest, if not dramatic, growth.  So the current jump belongs to this November.  All routes, Majors and Minors, were well above their year-to-date track records.  Milder, though wetter, weather?  Maybe.  A random anomaly?  Maybe, but not likely.  The results were too consistent across the board for it to be a celestial coincidence.  So we chalk it up as a mystery, at least to us, and move on.

Capture6

Graphs 7 and 8, Daily Vehicle Traffic, a clever Gabriola John invention, are loaded with useful information.  To wit, they show:

Capture7

Capture8


– the overall traffic growth trend for the past four calendar years

– the dramatic seasonality of traffic.  While it’s cool that traffic shot the lights out this month, the fact that November sits 9th out of the 12 months for volume tells us that it won’t have provided a major revenue bonanza.

The main point, comparing Graphs 7 and 8, is

a) that the Minor routes have consistently shown clear traffic increases over last year, the single anomaly being for rain-soaked September, while

b) the Majors have shown similar growth up to, but not including, this year, when monthly growth evaporated.

We have attributed this shift to the fact of the Minors enjoying the 15% fare cut, that was denied to the Majors.  Other factors, certainly (life is never that simple), but that seems like the outstanding one.

Graph 9, one of our favourites, would seem to show traffic is way less than what it might have been. And that is the case.  However, it also shows that traffic has been storming back at a substantially greater rate than the 1% green-line theoretical growth rate, for the past four years.  The size of the gap is the consequence of the long years spent in the Use Pay Wilderness.

Capture9

Lesson to be Learned:  Traffic can and will grow steadily in our environment of steady population and GDP growth, providing support funding doesn’t take a hard ideological turn to the right (again).

Graph 10 reminds us that BCF is now carrying more vehicles than at any time in the past, and almost more passengers than ever.

Capture10

Projected year end results for graphs 9 and 10 are based on BCF forecasts (which we now believe to be a wee bit optimistic).  Among the results of this growth rate are:

–  more and longer sailing waits,

–  potential customers avoiding ferry travel because of those waits,

–  fractured on-time-performance as crews shoehorn in as many vehicles as possible for the increased volume of ‘peak’ sailings.  Getting as many vehicles as possible on a given sailing has become the default Service Notice explanation for late sailings.  Exact same wording each time.  Sort of like Speed Dial.

BCF, to their credit has recognized this increasing demand trend and seems to accept it as a sustaining one, ordering bigger vessels, going to two for one replacements and building in a second ferry for Route 3.  There also seems to be recognition of a need for greater redundancy (back-up capacity) to deal with incidents of ships falling out of service at precisely the worst possible times.  For customers, the problem is the glacial procurement pace for new ferries.  The need is now, but the delivery dates are years away.  The arrival of the new ferries will, by themselves, result in traffic increases beyond those arising from the trends of the day.

So, next year?

Fares frozen at existing levels.

Traffic increasing, though not as quickly as BCF expected and hoped (but going in the right direction).

Climate change, apparently a reality in our part of the world, suggests another long, hot, possibly smoky summer, likely impacting ferry tourism, as this year.

The PT5 submission is now available for scrutiny and comment.  No heart-stopping direction changes evident, presuming everybody plays nicely with each other for the next nine months.  Worth FAC chairs doing a deep dive into it, confirming it’s as benign as it appears upon a quick read.  And if not, needs a focussed response on behalf of our coastal communities.

Comments?  If you wish . . .

Brian

October 2018 Ferry Traffic

Compiled by Brian Hollingshead…

October, a good news, bad news month. October_2018_Traffic_Stats

The good news is the Minor routes traffic increase over last October.  Graph 1.  Vehicle traffic up a robust 4.61%, passengers, up 3.39%.

Capture 1

And then . . . there were the Majors, vehicles off 0.37%; passengers, off 1.95%.  Throw in the northern routes up handsomely, but accounting for less than 1% of the traffic, not really adding anything to the corporate traffic picture.

End result:  System vehicle traffic up 1.68%, passenger traffic down 0.06%.  Sort of like getting kissed by that great aunt you don’t much care for.

The year-to-date results (graph 2) mirror the Oct ones.  The Majors are struggling while the Minors have been bringing home the bacon all year (and keeping the System results halfway respectable).  Rte 3, which usually behaves, traffic wise, like a Minor route, this year seems to have suffered, and continues to suffer, the Major route malaise.  As suggested previously, capacity constraints and less than stellar on time performance, have no doubt contributed to these results.

Capture 2

Graph 3, October System traffic performance shows the four years in the Wilderness, followed by a year of growth, a flat year, another growth year and then flat again this year.  The squinty-eye picture is valid.  October traffic, like the full year traffic, suffered for four years, and has been steadily improving since then.  The comparison of individual Octobers can be significantly influenced by weather as well as other less dramatic factors.

Capture 3

The Minor routes version of the same graph presents a similar pattern, other than this October is a substantial improvement over October, 2017.

Capture 4

The Thirteen Month System traffic graph 5 partly explains the apparently lack-lustre performance this October.  Last October, traffic was booming.  To maintain that level or improve slightly upon it is still respectable.  This indicates the risk of putting too much weight on year over year results.  Any particular change may say more about what was happening a year ago than what’s happening now.  The summer results reflect the same, somewhat misleading, situation.  Last year, ferry traffic got a huge boost from the wildfires, as they effectively diverted a great deal of visitor traffic from the interior to the coast.  This year, another set of wildfires messed up the whole province, covering us all with a blanket of choking smoke.  Visitors responded by staying away, remaining in their hotels or abruptly shortening their stay.

Capture 5

The Minor route daily traffic picture, graph 6, returns to its previous healthy trend.  The dip last month was likely the result of uncharacteristic September monsoons.  The traffic growth pattern for the Minors remains strong and consistent.  Of course, not all Minor routes behave the same way.  Last month, they were all over the map for gains and losses.  This month, they’re pretty well all showing 3%+ growth, with the exception of rte 20, with a 7.3% vehicle traffic loss and a 1.6% passenger drop.  But overall, it was a solid month for the Minors, with pretty well all routes pulling in the same direction

Capture 6

By the same token, the Northern routes group numbers are misleading.  They’re often, as this month, up on one route, usually rte 11, and off on the other.  Again, rte 10 enjoyed a spectacular season last year, with it being the primary route north, while Hwy 97 was shut down with the fires.

Graph 7 gets past the month-to-month looks and presents the full year-to-year changes since the present structure arrived on the scene.  As seen with most of the monthly pics, there were some hard years that seemed to accidentally coincide with a litany of steep fare increases and gruesome fuel surcharges.  The increases were substantial and then they grue some more.  This graph now has the traffic results extrapolated to include FY2019, based upon BCF projections of 2.6% vehicle growth and 1.6% passenger growth.  Not for us to say, but those projections may turn out to be a tad optimistic.  As has been on a number of occasions, the bottom line is that, coming from where it was, traffic is darned good.  So good in fact, that it’s stressing the system’s capacity to meet the demand, especially on some routes and in the busy season.

Capture 7

The Long Look, back to 1990, (graph 8) traces the consequences of the ideologically driven ‘user pay more, a lot more,’ approach of the government through the first decade of the present regime.  It, too, now projects to FY2019, based on BCF traffic projections.  The most recent dark years have been followed by four-going-on five years of more enlightened fare increases, with corresponding traffic growth.  Some see this graph as a celestially ordained, or naturally occurring, cyclical process.  It kind of looks like a lumpy sine wave.  We might shyly suggest it’s more the result of governments, both orange and blue, overlaying their ‘fairness’ philosophies on the coastal ferry service.  And then, after half a dozen or so years, experiencing an ‘oops’ moment and rethinking and revising those philosophies .  And gosh, traffic then rebounds.

Capture 8

Balance of the year?  Probably modest traffic increases, but less than might have appeared likely six months ago.  The current BCF direction of broadly increasing capacity and relatively quickly, still makes a lot of sense.

The 15% fare cuts did what they were intended to do, increasing traffic and bring a ray of hope to the battered coastal communities.  The fare freeze next year should assure that the robust traffic on the Minor routes sustains.

Comments, feel free.

Brian

September 2018 Ferry Traffic

Hi all,

A traffic-sucking, slurpy September.  That record rainfall, hard to forget. September_2018_Traffic_Stats

A reminder that weather can upset the trend in any given month.   Summer smoke – we can call that weather – and September rains derailed the hitherto upward traffic trend.  Check out graph 1.  System vehicle traffic down 0.05% (effectively flat) and passenger traffic down 1.39%.  The Majors lost both passenger and vehicle traffic.  The Minors, a little better, but not much, with vehicle traffic up half a percent.  Rte 3, an almost carbon copy of the Minors.  While the North appeared to be bucking the trend, the increase there was almost totally the result of the new traffic on Rte 28.

Capture 1

The year-to-date picture, graph 2, is some healthier, based on the April to June increases.  The Minors were the beacon of hope, while the Majors struggled.  The assumption here is that the 15% fare cuts on the Minors provided a boost, one that was missing on the Majors with no fare cuts.  Not surprising.

Capture 2

Peeling the weather onion, the Big 3 Majors all lost both vehicle and passenger traffic.  They also carry a heavier percentage of discretionary traffic than the Minors.  Discretion may be the better part of valour.  It also seems to be the better part of taking a fun ride on a ferry in the rain.

The Minors’ anaemic performance on the other hand does not reflect individual route results.  Those were all over the map, from up 5% on some routes to down 5% on others.  It just happened the ups and the downs balanced each other.  Explanation for these results can only lie with the individual routes.  There’s not a common explanation that fits them all.

Graphs 3 and 4 illustrate how this September fits with previous Septembers back to 2009, for both the System and the Minors.  Four years of steady growth, and then ‘blah’ for this September.  While disappointing to see that growth pause, we need to keep in mind that the increased traffic level attained over those past four years as been sustained, more or less, this past month,  Still a lot more wheels on the deck and bums on the seats than four years ago.  And overloads.

Capture 3

Capture 4

The 13 month look (graph 5) is interesting, in that the heady gains of a year ago started cratering in June and have effectively ceased to exist since then.  The drop in April was due mostly to the loss of the front end of the Easter weekend this year (vs the full Easter weekend last year).  As noted earlier, this summer (June through September) has been one of ferry-unfriendly weather.  The October results should be better, with the caveat that traffic last October was exceptional (8% above that of the previous year).  It will be a challenge to improve upon that.

Capture 5

Graph 6, the daily traffic tracker presents the first bleep in our text book picture of steadily growing Minor route traffic.  The bleep notwithstanding, the picture has been and remains one of consistently increasing traffic volume on our routes.  One sucky month doesn’t alter that.

Capture 6

The Big Picture, illustrated in graphs 7 and 8, will continue to reflect traffic growth, just not as dramatically as for the past three years.  That said, BC’s coastal population is still climbing every day and the healthy economic climate suggests continuing GDP growth.  Both are primary determinants of ferry service demand.  Barring any unforeseen cataclysmic events, it seems reasonable to expect continued ferry traffic growth.  Fleet capacity increases with the new boars will help.

Capture 7

Capture 8

So, what to expect . . .

Last month, we forecast year end system traffic growth of 2% for vehicles and 1.5% for passengers.  BCF, in their PT5 submission, went out on the limb above us, contemplating 2.6% vehicle growth and 1.6% passenger growth.  At this time, I suggest both are optimistic, though ours less so.  Interesting that the submission anticipates no growth or decline through PT5.

Overall, coastal ferry traffic has come a long way in the past four years, though hitting a bit of a rocky patch this past four months.  That said, the fundamentals remain in place, and there’s no indication of resumption of punishing fare hikes.  Once capacity more or less catches up with demand, the future looks promising, both for traffic levels and for the economic and social well-being of our communities, so dependent on this life-sustaining service.  There seems to be a harmony of vision shared by BCF, the Province and the coastal communities, one that’s most welcome.

Enough!

Feedback always welcome.

Brian

FACC Meetings with Government, the Commissioner and BC Ferries Executives

Each year the Ferry Advisory Committee Chairs are brought to Vancouver courtesy of BC Ferries to attend their Annual General Meeting. We take this opportunity to meet with their executive team, the BC Ferry Commissioner and with the Minister of Transportation and Infrastructure who is responsible for BC Ferries. Attached are the notes from these meetings, all of which have been approved for distribution by the various parties: BC FAC Chairs Meeting August 2018

August 2018 Ferry Traffic

Hi All,

Call it Smokie II, a just slightly healthier version of July traffic. August_2018_Traffic_Stats

Overall traffic up about 2%, (graph 1)  Majors, slightly less anaemic than last month, up 1%.  The Minors up 3.8% for vehicles and 3.5% for passengers.  Once again, the smoke dampened people’s interest in scenic travel, as well as tourism generally, resulting in August’s less than expected results.

Capture 1

While the smoke affected the summer traffic, it needs to be borne in mind that Major route travel has been flat all year, as suggested by the YTD graph 2.  It does seem that the 15% fare cut on the Minors has fuelled their year-long traffic increase, while the lack of same on the Majors probably explains their doldrums.  Not surprising.  Rte 3 is the anomaly, having enjoyed the fare cuts, but not seeing any material traffic increase.  Perhaps the lack of capacity (sailing waits) and lack of on time performance on the route contributed to the dampening effect.

Capture 2

Graph 3 reminds us that while System traffic was just modestly up over last August, it’s still higher than it’s been since 2009, and above a bonanza year last year, smoke and all.  So, no tears, please.

Capture 3

Graph 4, shows August Minor route traffic on steroids, compared to previous Augusts.  The fare cut has been a remarkable shot in the arm for traffic, and traffic is a surrogate for the economic and social well-being of our communities.  The side effects of record traffic – overloads and sailing waits -are frustrating.  That said, there is much-needed relief in sight for the hardest hit routes with the anticipated arrival of the first replacement ferries, followed by the five additional boats presently in the approval process.  Anticipated delivery of the latter group is in the 2020/2021 time frame.

Capture 4

The 13-month track, graph 5, suggests this fiscal year’s performance since June as been positive but definitely less starry than that of last year.  This is consistent with the YTD graph 2, but on a month to month basis.

Capture 5

Vehicle traffic per day on any route or group of routes illustrates whether there are erratic results, or if there is a constancy.  Graph 6 showcases the strong performance of the Minor route group, pretty much every month, every year since 2014.  A comparable graph for the majors would show similar, though less robust, growth up to this year, and then the black line intertwined with the blue.

Capture 6

Let us not forget.  We’ve said enough about graphs 7 and 8 in previous episodes.  Suffice to say, traffic is hot, recovering from a too long spell in the wilderness.  If and as capacity catches up to demand, we should be able to see the current trend continue, though perhaps at a less robust rate.

Capture 7

Capture 8

The future?  In the absence of any catastrophic events between now and April, look for a vehicle traffic increase of 2%, year end, and 1.5% for passengers.  March should be down from 2018, as it will lack the freebie half Easter weekend it enjoyed this past year.  With August now in the bag, the remaining seven months aren’t likely to move the needle very much.  Unless we get a zombie winter, and then all bets are off.

Last month we wondered about the relative percentages of reserved space vs deck room left for ‘standby’ customers.  For the Labour day weekend, it boiled down to reserving between 80% and 90% of the passenger deck space on routes 1 and 30.  However, given commercial traffic was down for the weekend, overall pre-committed space was generally under 70%.  It meant giving the maximum number of people assurance they’d get where they wanted to go, when they wanted to get there.  The result was a less rosy picture for the standby guys.  Worked pretty well except when the Spirit of BC lost two round trips early Friday, and the day collapsed into chaos on the route, with a lot of disappointed folk who saw their reservation certainty evaporate.

As always, any questions, protests, denunciations or other rude comments, feel free.

Brian

July 2018 Ferry Traffic

FACChairs,

BC Ferries Traffic Stats Download: July_2018_Traffic_Stats

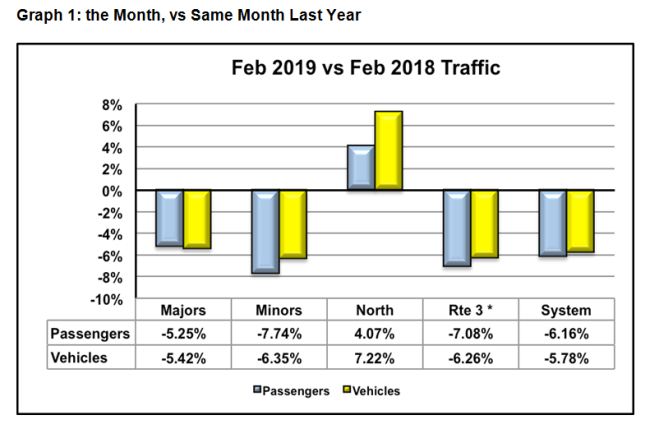
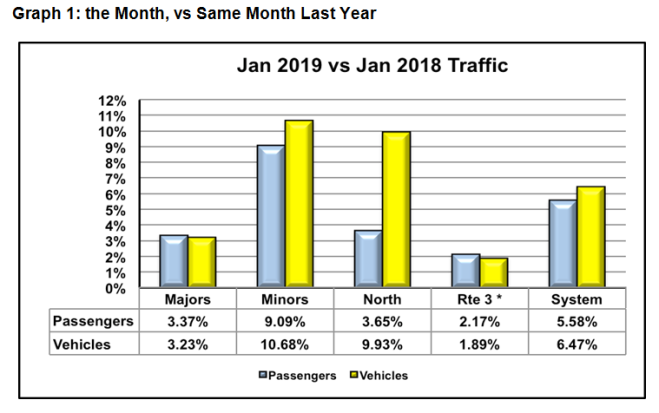
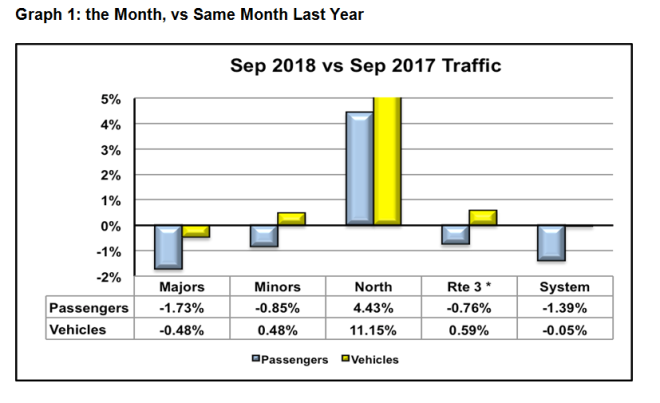
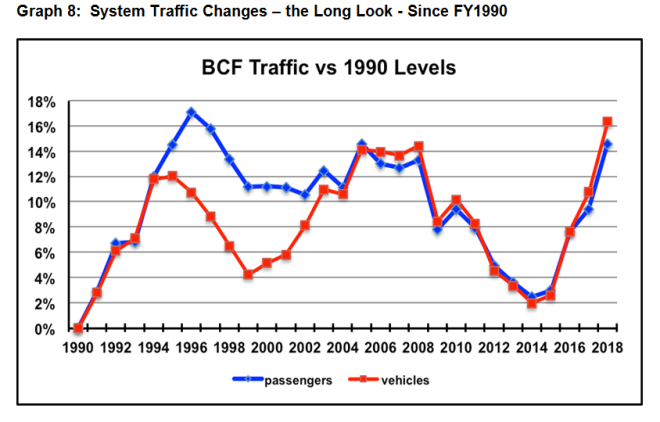
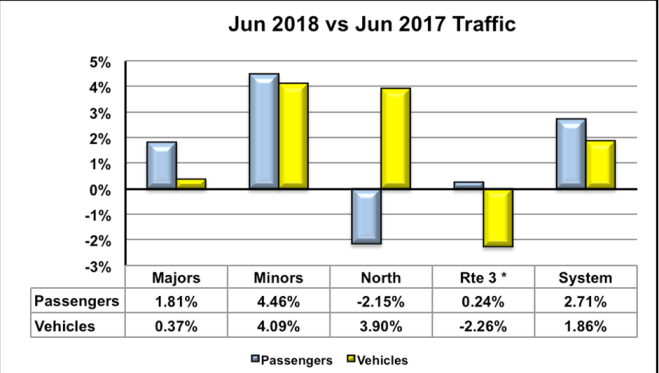
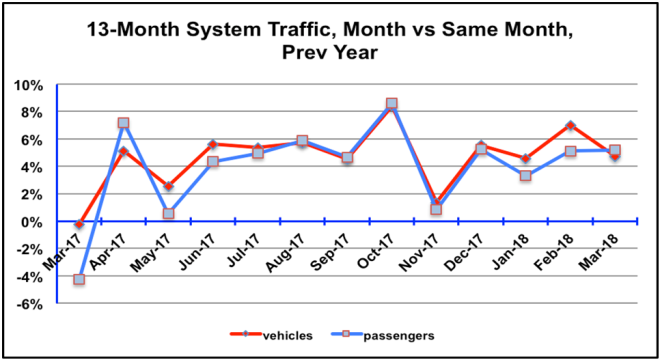
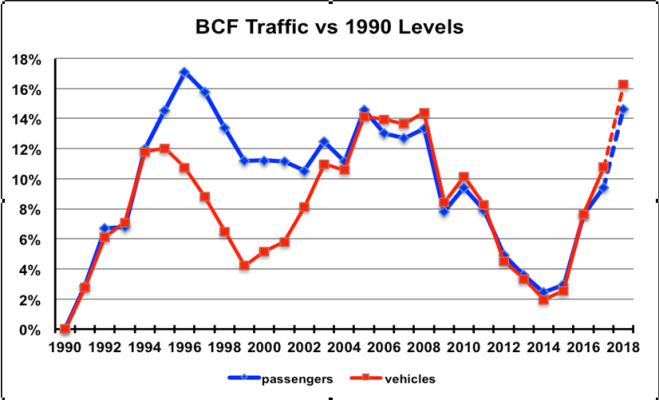
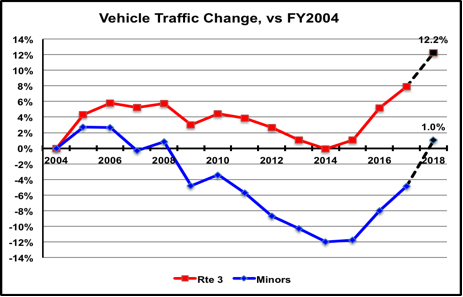
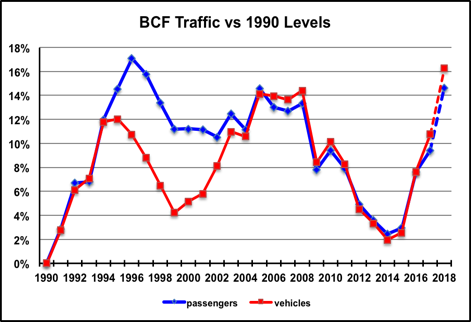
A smoky month with surprising, and not so surprising, traffic results.  System vehicle traffic was up 0.9% while passenger traffic was down 0.06%.  Graph 1.

Capture1

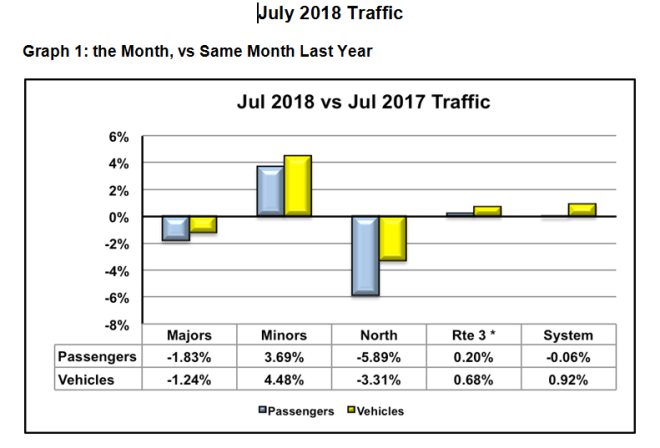
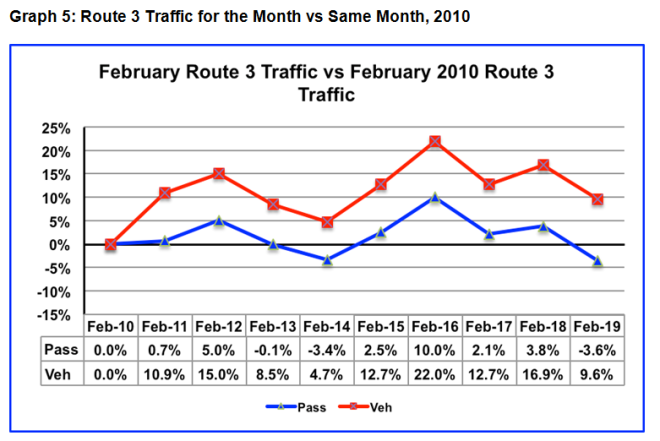
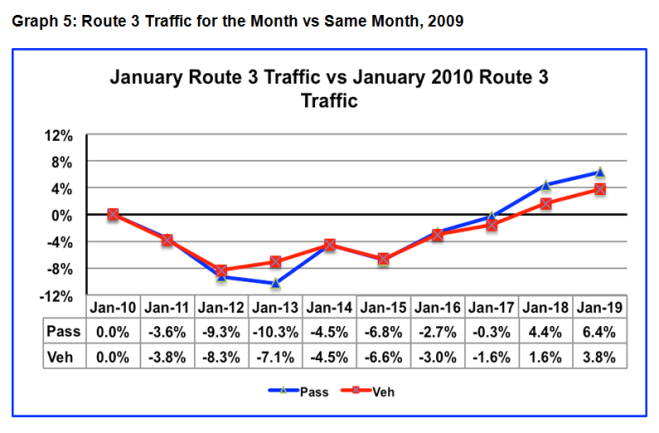
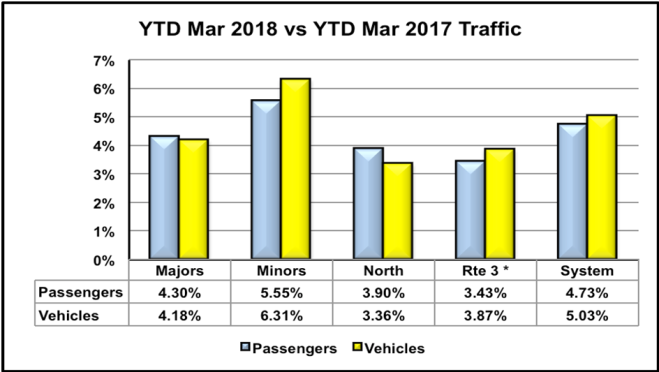
The Majors were down from last July on all but Rte 3, which is essentially flat.  As per Graph 1, vehicles down 1.2%; passengers, 1.8%.  Disappointing, but not the end of the world.

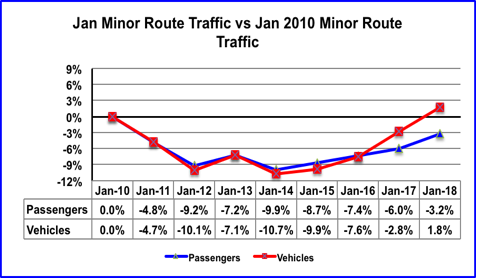
Meanwhile, the Minors were up significantly on almost every route, vehicles 4.5%; passengers, 3.7%.

How could this be?

The  Majors’ drop is likely due to two things, the first being the pervasive pall of smoke.  It’s keeping out-of-province visitors away, and keeping British Columbians home.  That and last year was a bonus traffic summer for ferries as many vacation travel plans were redirected to the coast due to the devastating wildfires in the interior.  That bonus factor was gone this year as coastal destinations were equally blanketed with the Grey Misery.  So, the smoke dampened travel and the traffic comparison was to an inflated high volume last year.  Traffic off, no surprise.

But the Minors had the same smoke and the bonus traffic last year.

Indeed.  But the Minors also had a 15% fare reduction, not enjoyed by the Big Three Majors.  Price elasticity still seems to work.

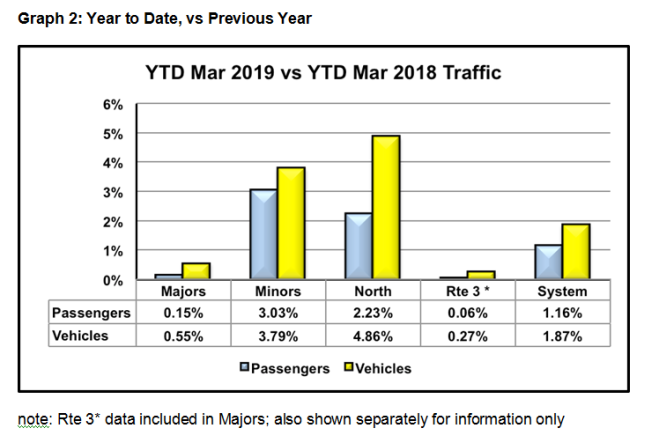
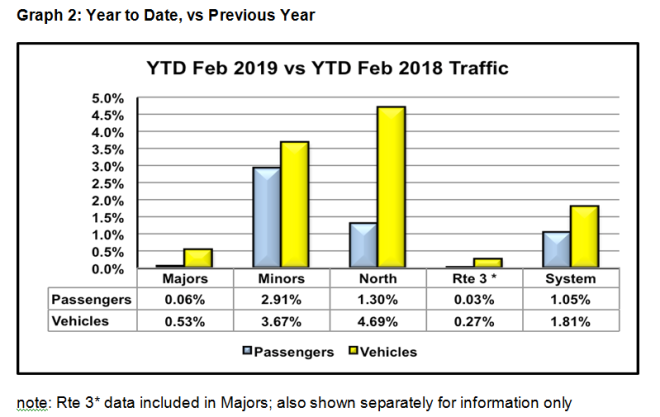
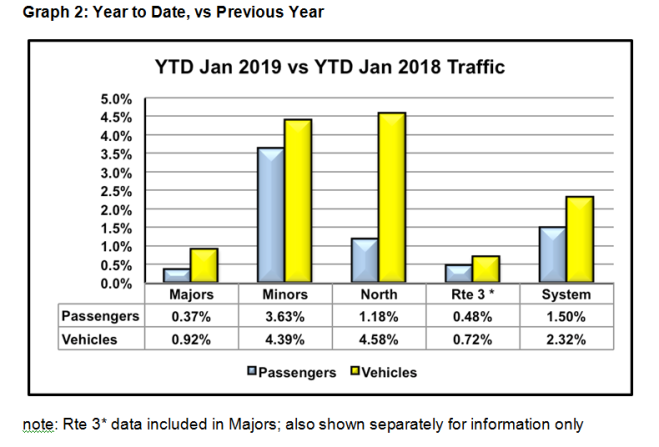
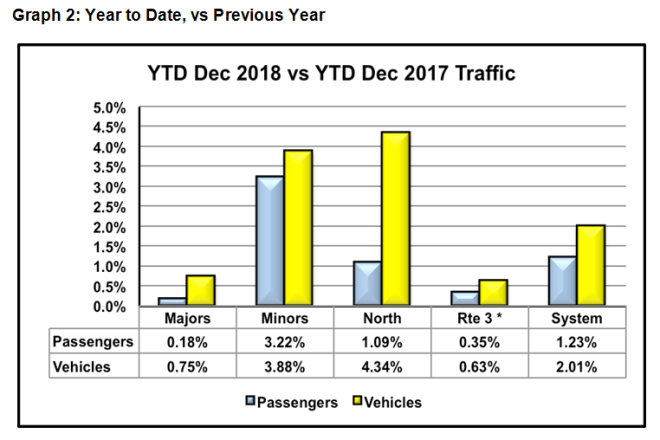
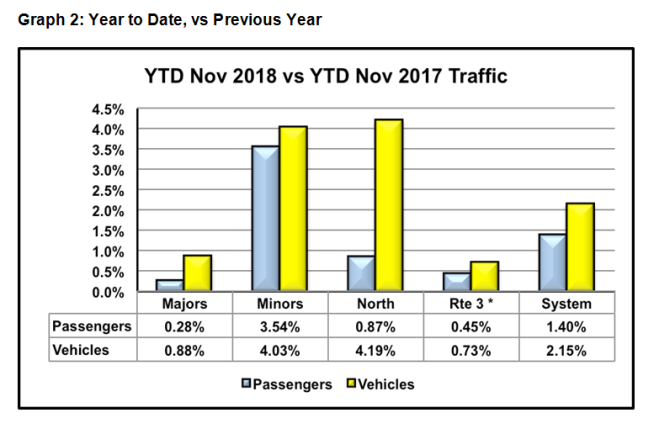
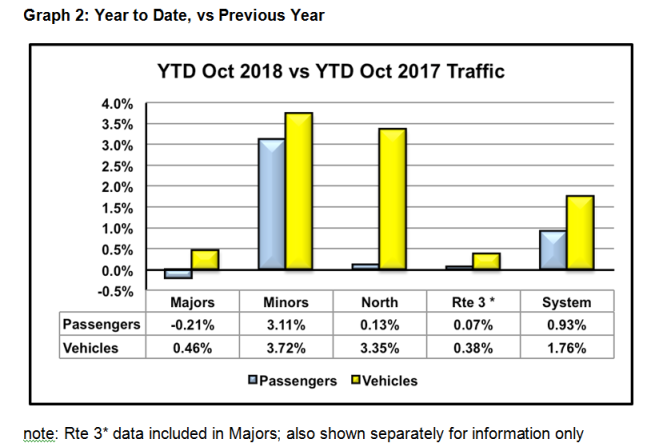
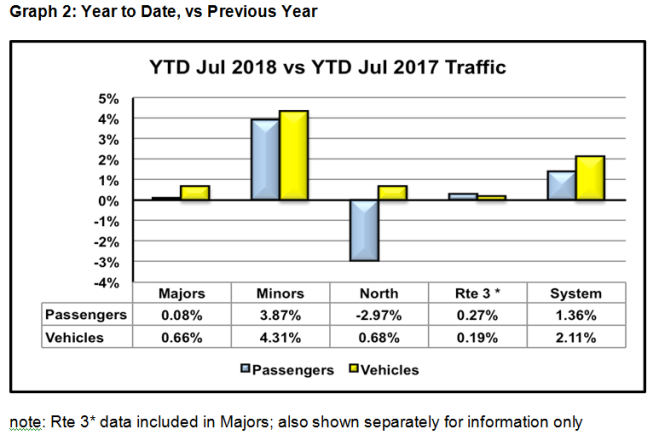
From Graph 2, it’s evident the Majors’ traffic has substantially lagged that of the Minors since April.  The modest System traffic growth is almost entirely due to the Minors’ contribution.

Capture2

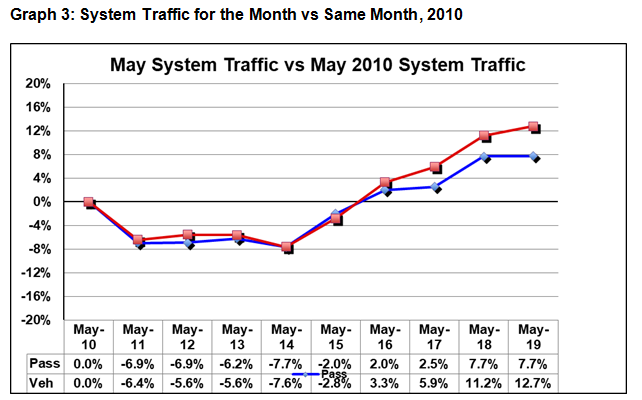
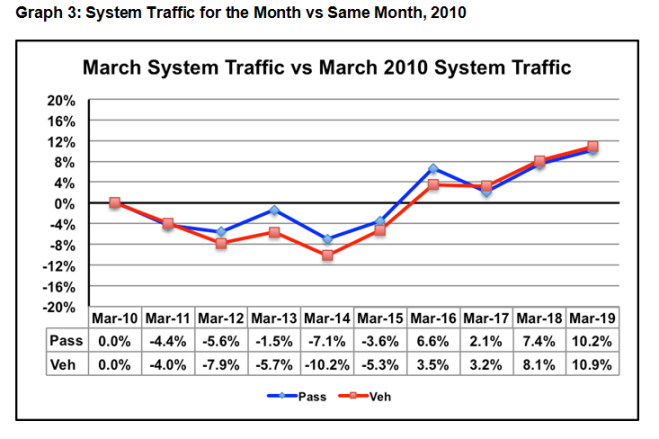
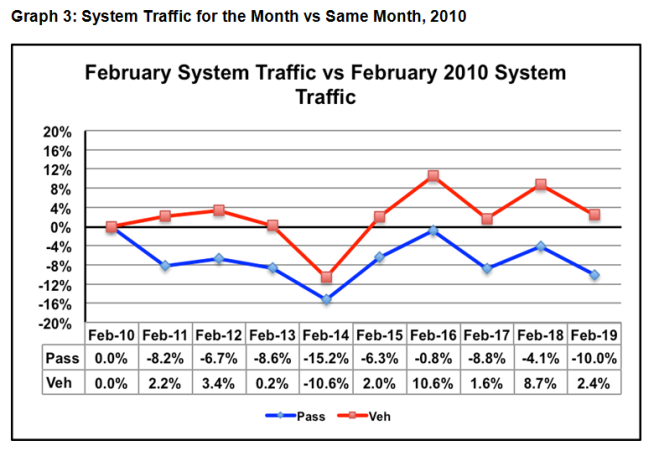
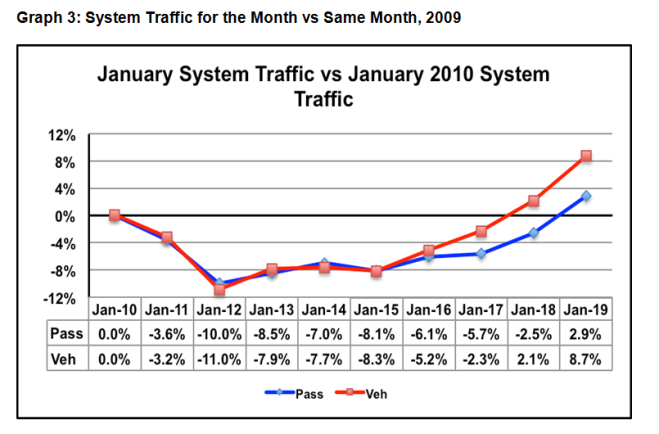
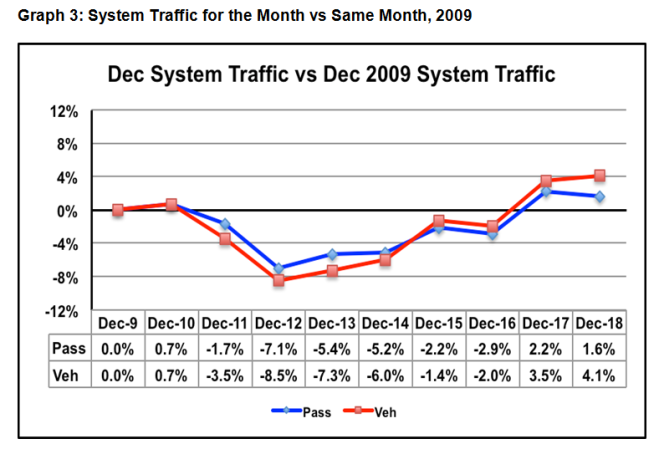
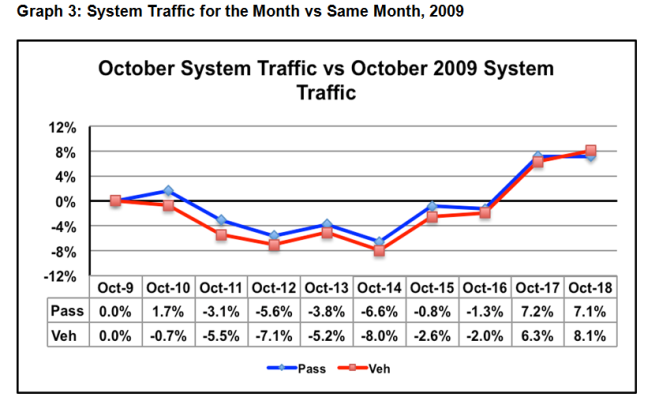
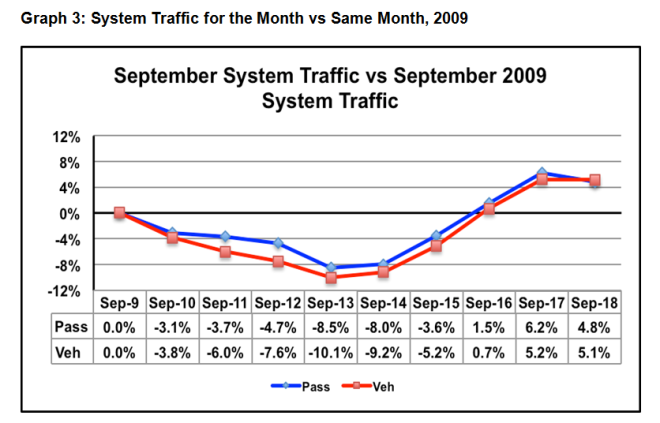
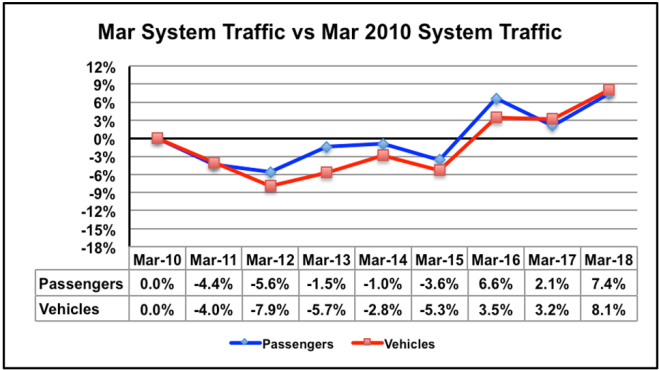
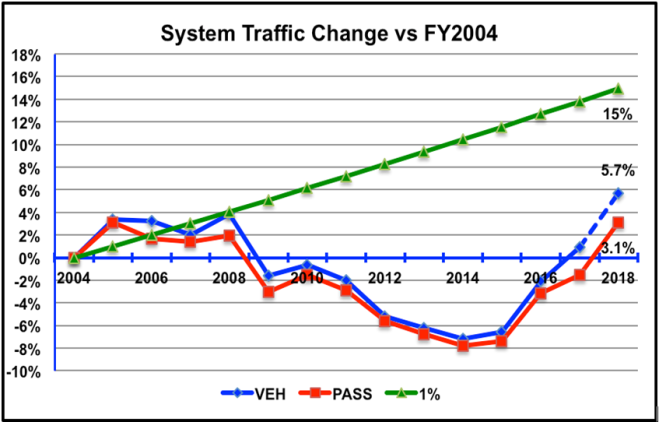
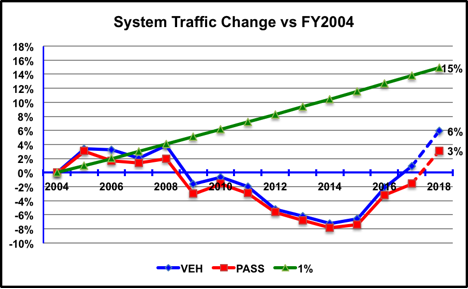
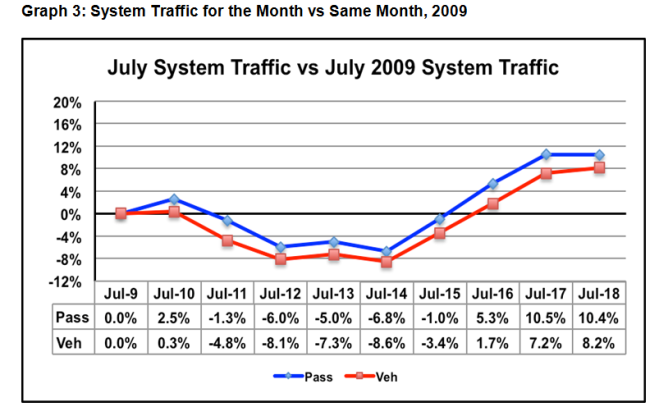
System traffic this July essentially stalled at last year’s level, after three years of steady growth (Graph 3).  Traffic was dampened on one hand by the smoke and buoyed on the other by the 15% fare cut (Minors, Rte 3 and the North) and return of the seniors’ freebies.

Capture3

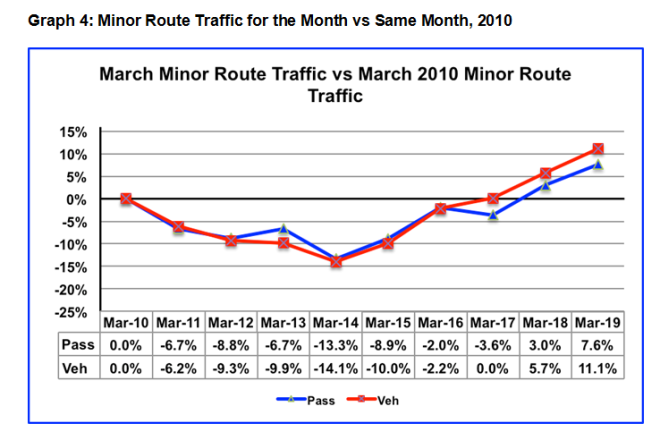
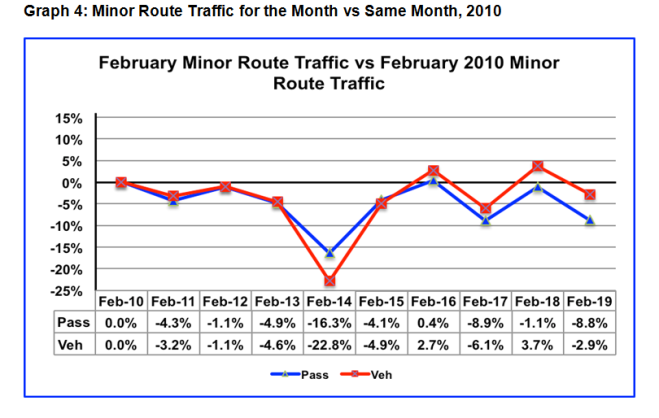
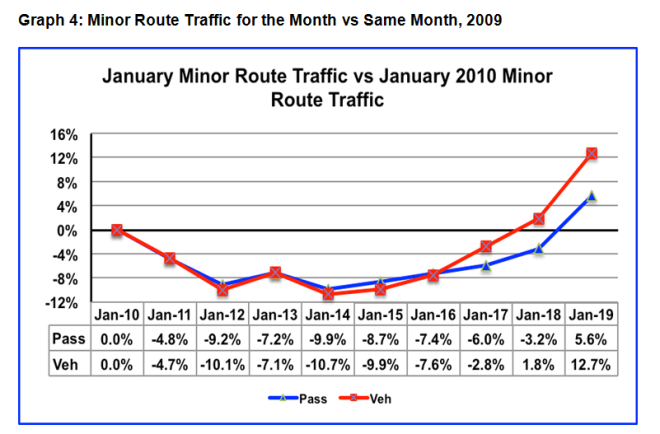
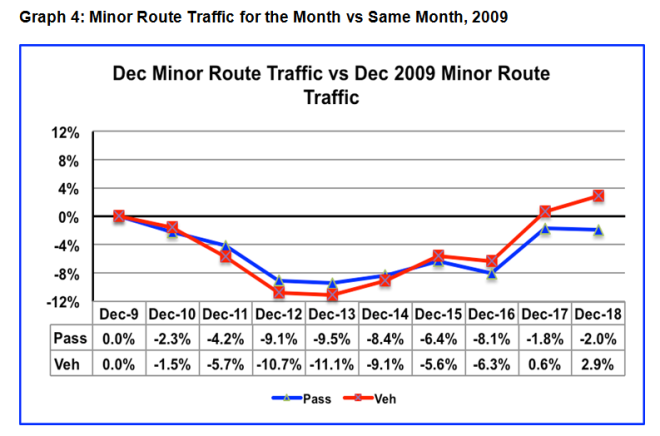
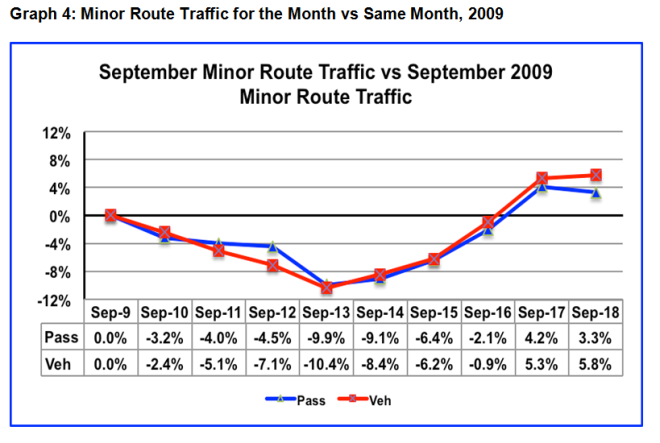
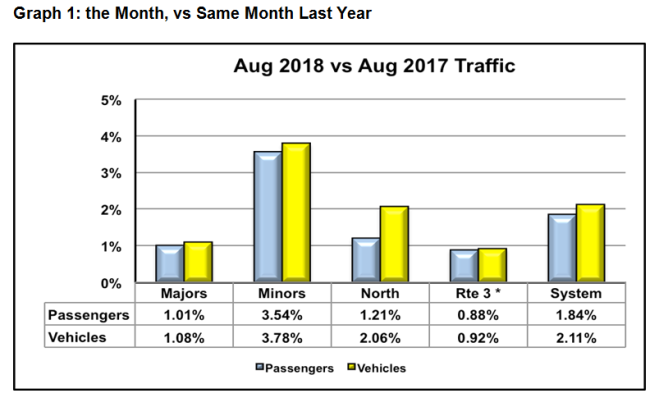
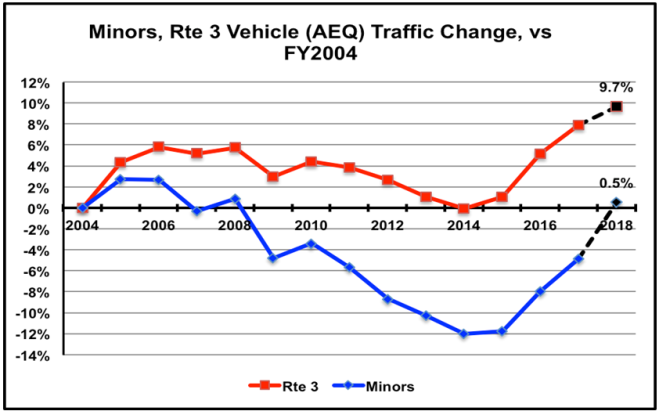
Meanwhile, Minor route traffic this July notched a fourth straight year of substantial growth (Graph 4), thanks in large part to the 15% fare cut.  As discussed previously, the traffic boost is good for local businesses and the general well-being of the communities.  But the inability of BCF, with its limited capacity to accommodate the increased demand, is leading to unprecedented sailing waits on more routes, and more sailings on those routes.  While nobody would suggest raising fares to constrain traffic, the longer and more frequent waits are becoming increasingly painful.  The new, greater capacity ferries are eagerly awaited.

Capture4

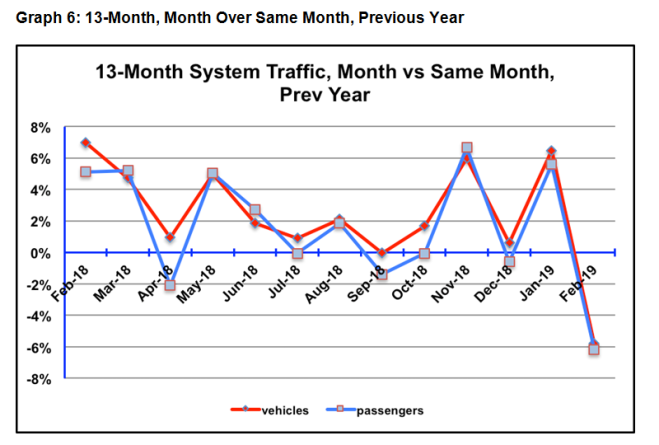
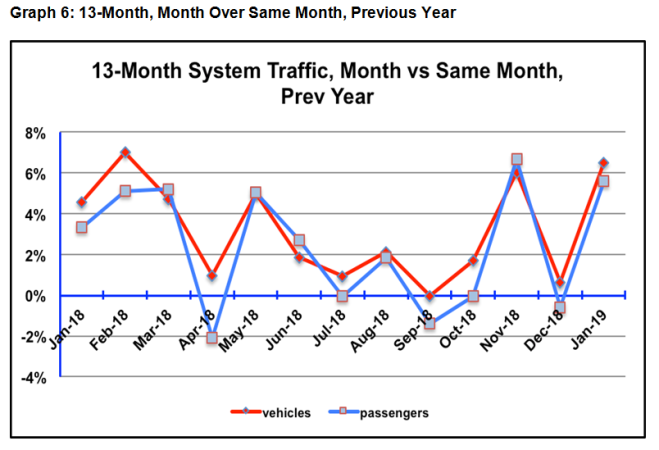
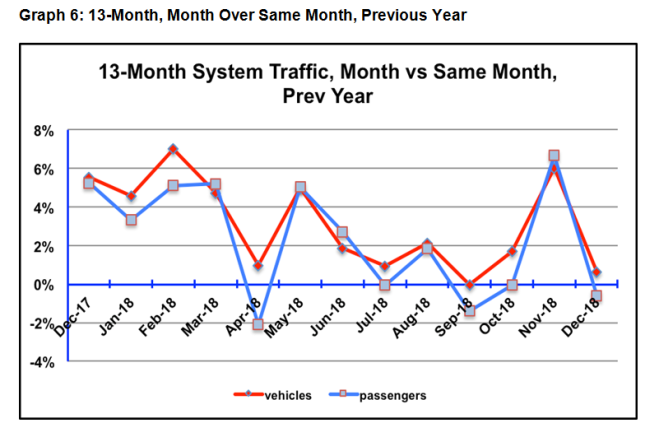
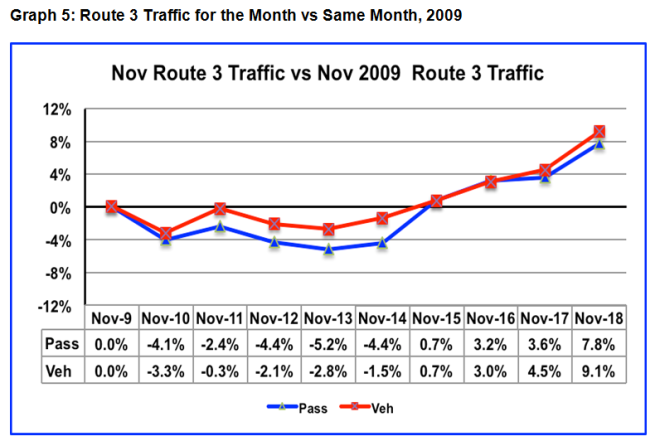
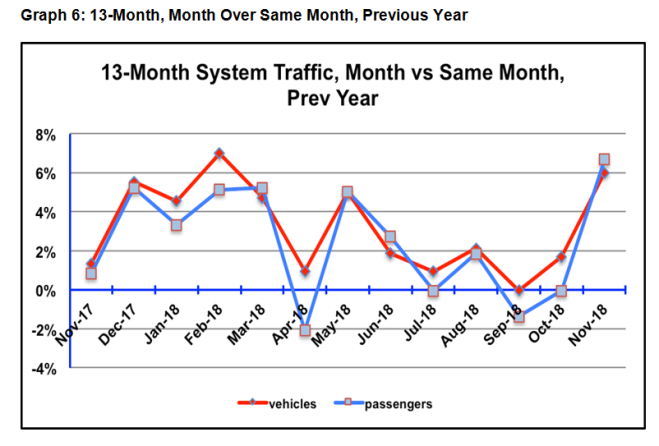
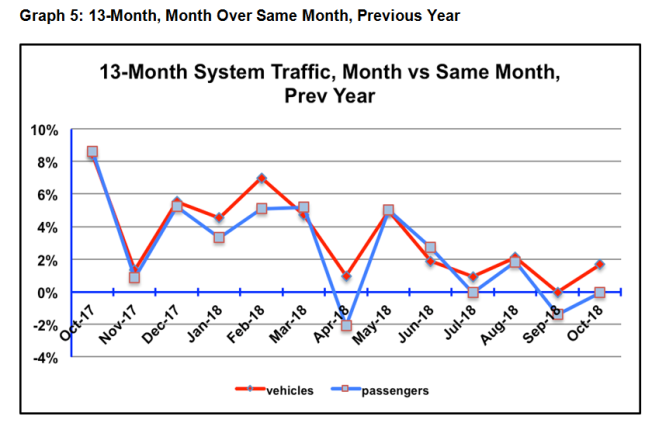
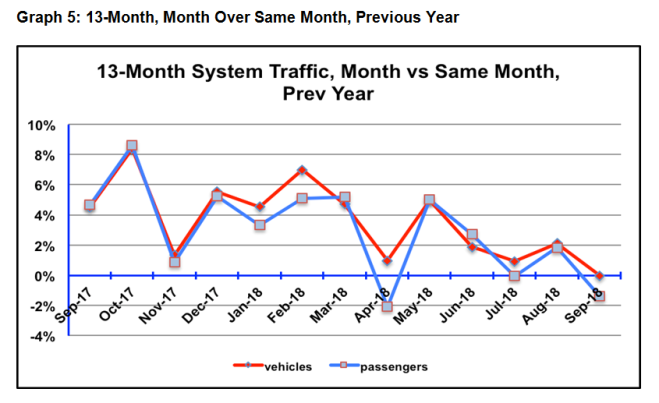
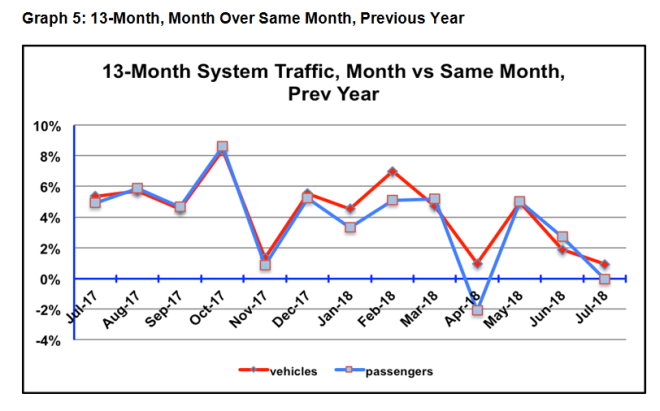
The 13-month System traffic look (Graph 5) pictures some excellent months, compared to previous year results, and some OK ones.  This July was an OK one, but one has to bear in mind that last July, to which it’s compared, checked in with 5% traffic increases.  Matching that traffic level, not too shabby.

Capture5

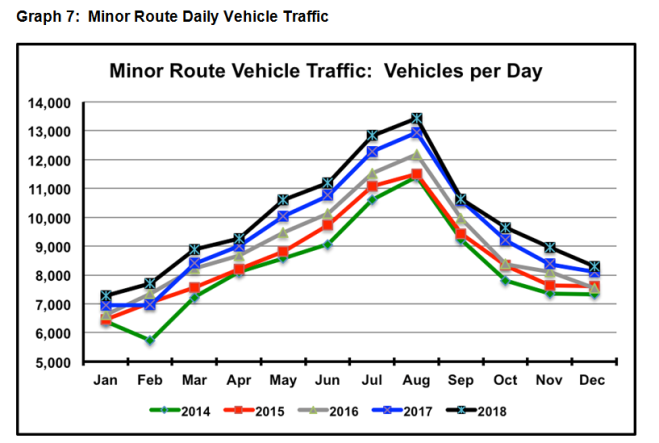
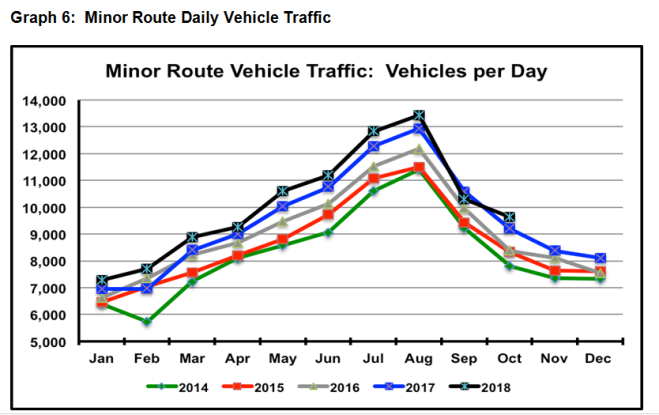
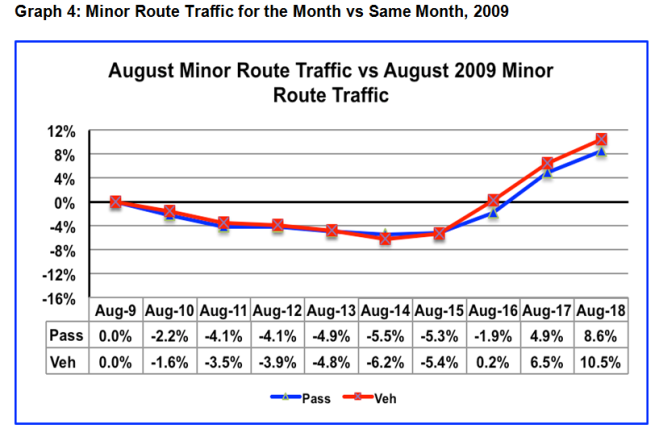
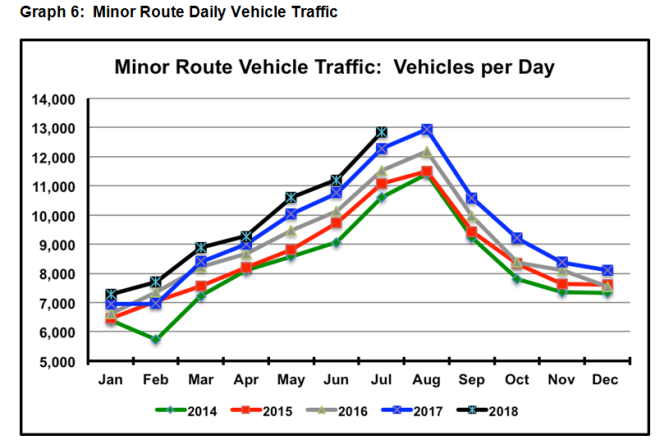
Graph 6, the Gabriola John Daily Traffic map shows the steady Minor route traffic growth for the past four years.  Interesting that it’s consistent, year over year, and virtually every month.  Not all routes present such a tidy picture, but in aggregate, it’s text book.  Even now, this trend is being constrained by capacity shortfalls.  As the newer, bigger ferries come into service, look for the growth rate to increase.

Capture6

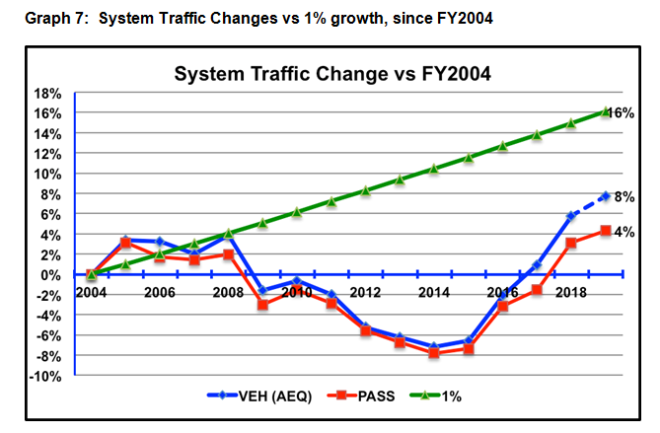
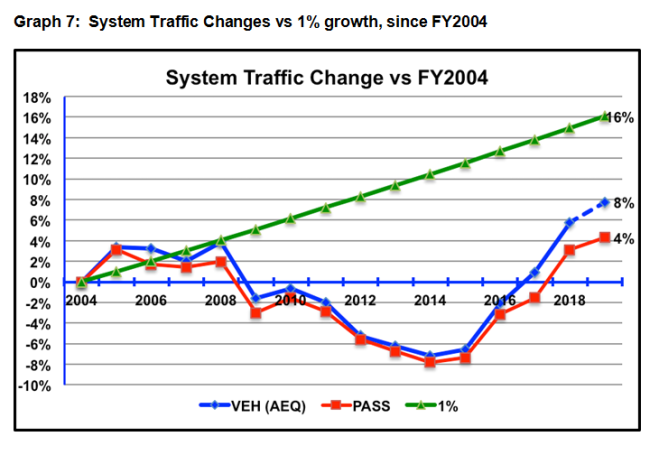
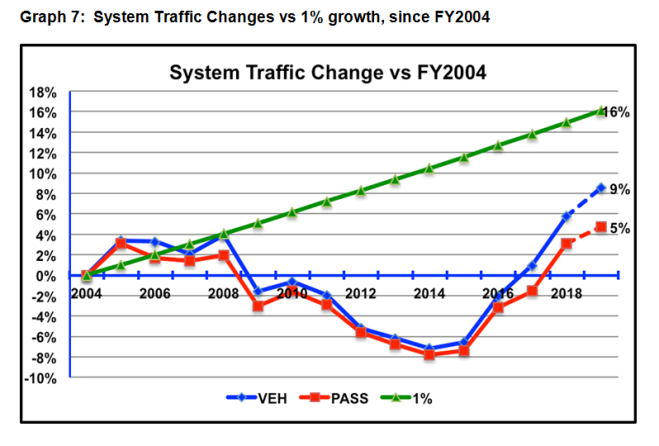
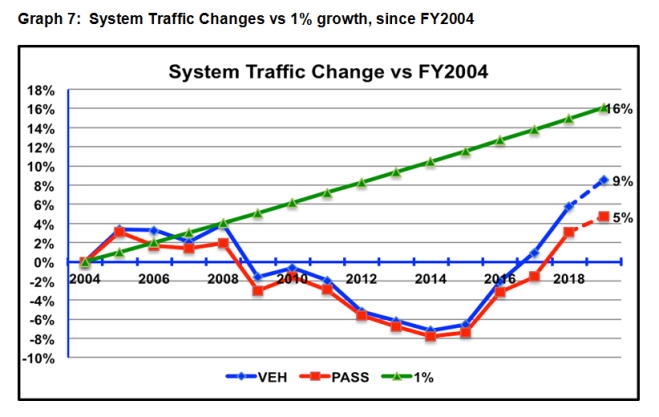
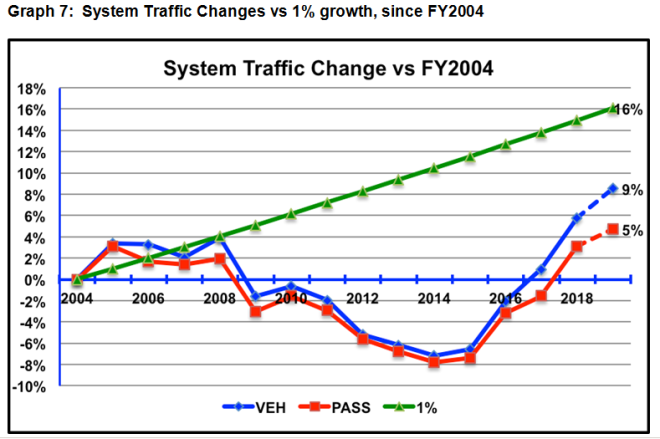
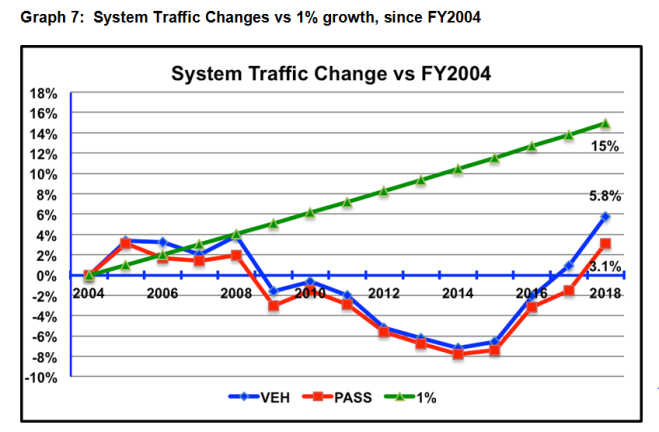
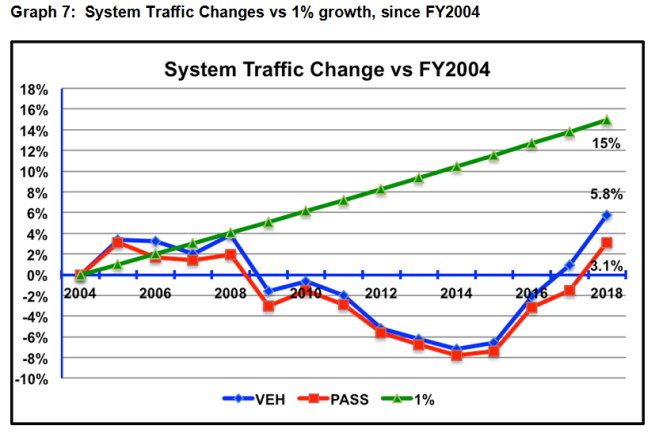
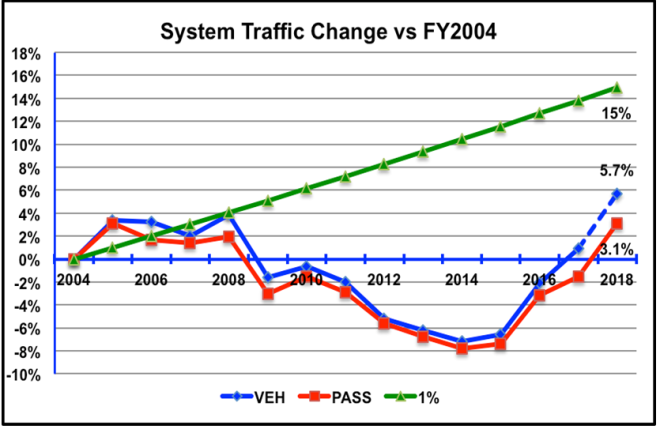
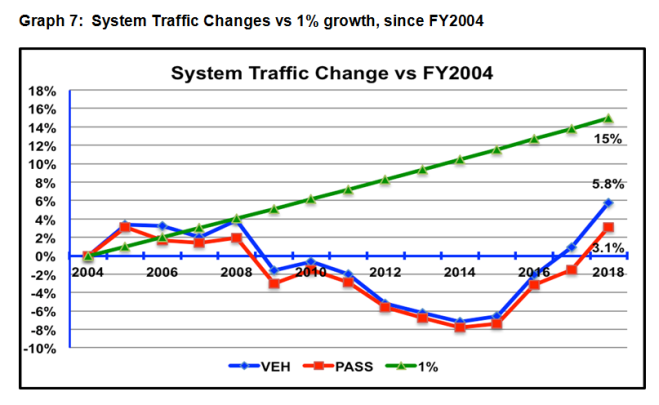
The Let Us Not Forget picture, Graph 7, illustrates the three year-traffic rebound after seven years in the ditch, and compares it to where it might reasonably have been in an earlier environment of modest fare increases.  Increased tourism, population and provincial GDP, together with recent minimal to no fare increases have essentially made current fare levels more acceptable.

Capture7

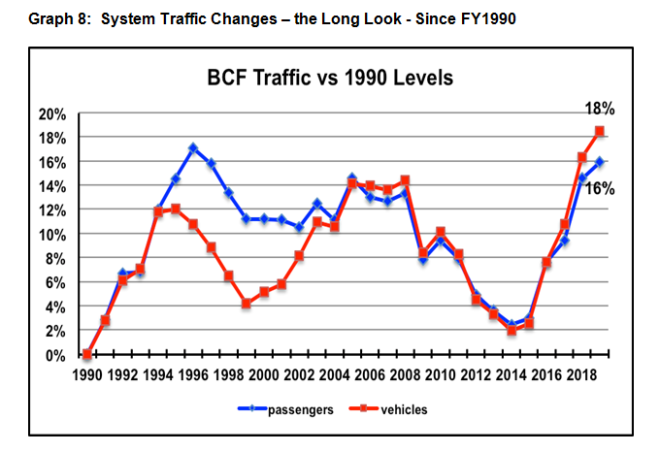
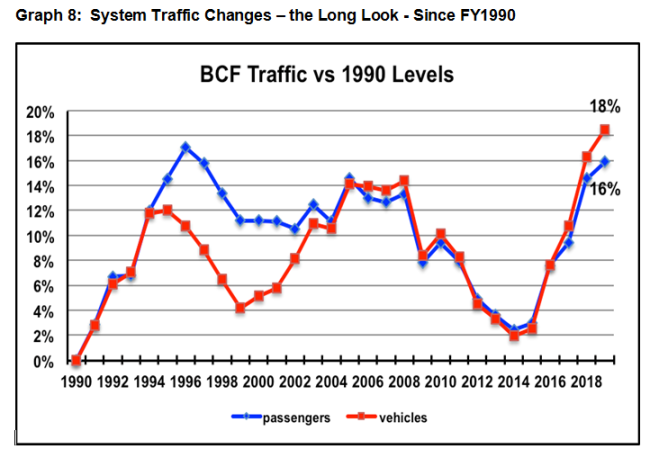
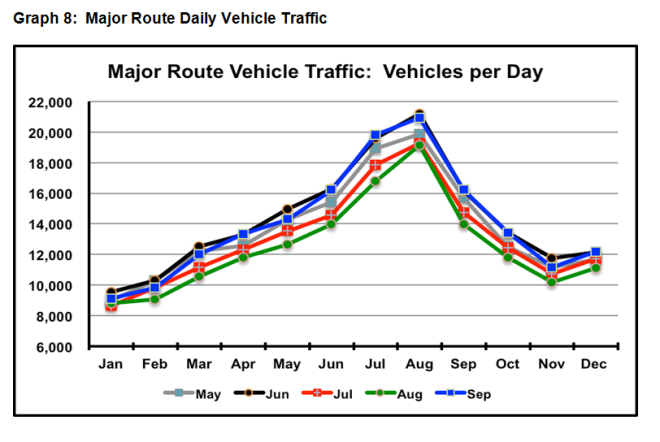
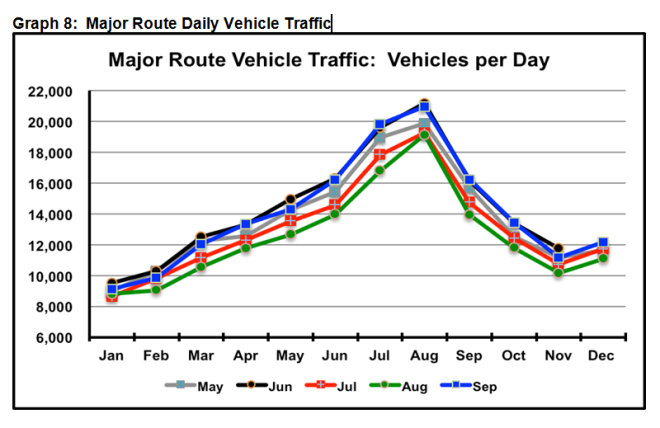
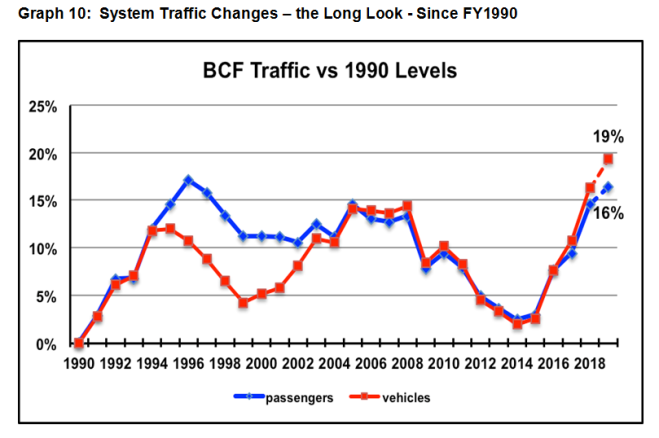
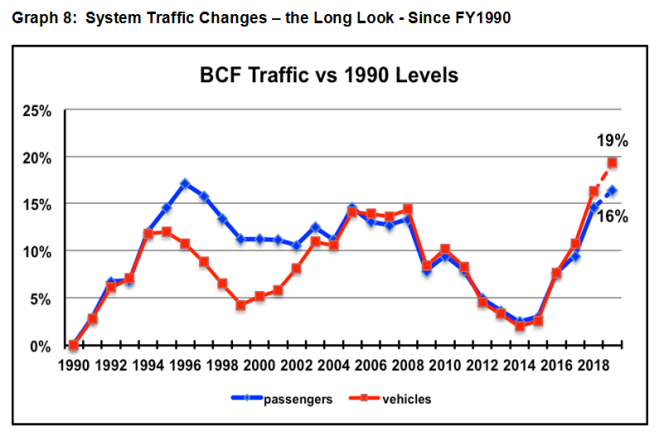
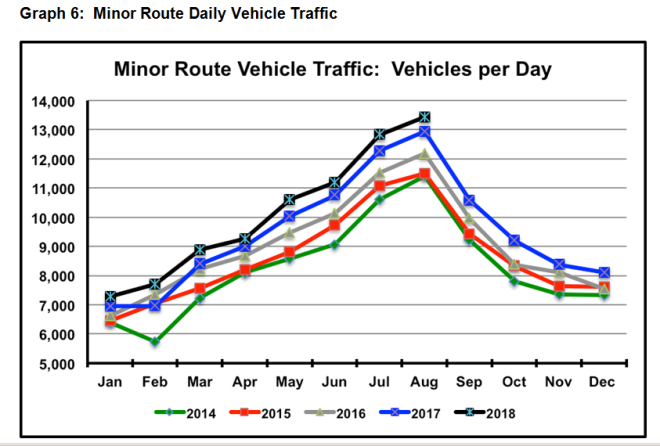
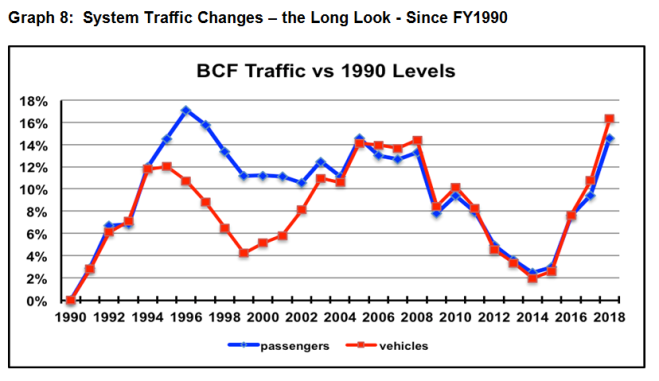
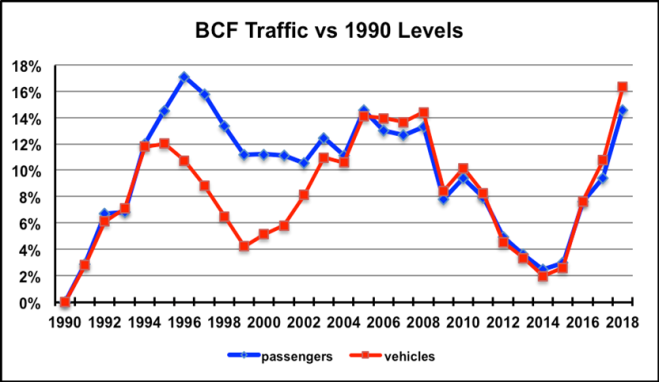
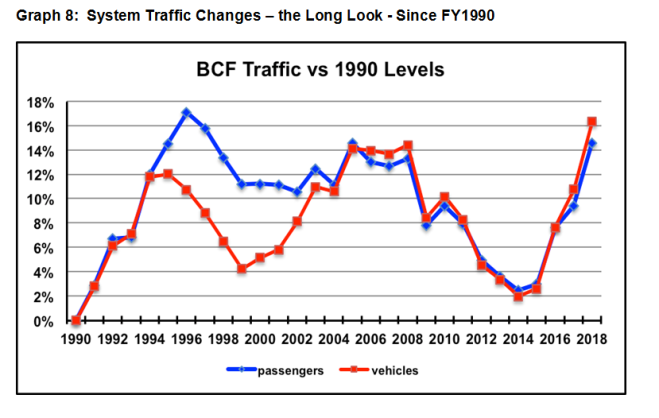
Graph 8, the Long Look, reminds us that indeed, BCF is now carrying more vehicles than ever.  This appears to be more a recovery effort than a normal growth situation, traffic catching up to where it might have been in the absence of the ‘situation’ that collapsed traffic earlier.

Capture8

So, what might we expect?

1. August results likely to be similar to those of July.  Smoke, extreme fire hazard, drought. Not exactly inviting.
2. Year end results, positive due to 15% fare cut on all but the non-Big Three Majors and the seniors’ freebies, but dampened due to summer getting smoked out, and coming off bonus year last year.
3. Year to year expectations are based on no major changes.  Possible major changes could include Climate Change (wildfires are real, not hoaxes) or substantial economic malaise arising from trade practices of our southern neighbour.  As we’ve learned, there’s a lengthy dark menu of never-before-seen events that can dramatically alter our ferry world.
4. But for now, we have a magnificent coast, safe communities and a sound economy.  Bodes well for the positive ferry service trends.

A new wrinkle . . . have a look at the CHEK attachment. CHEK 180827 long waits It appears BCF has dramatically increased the percentage of deck space they’re committing to reservations on rte 1, and possibly on rtes 2 and 30.  That translates into more multi-sailing waits for the standby customers, competing for much less space on each sailing. Note Deborah Marshall’s reference to 45% to 75% of capacity being committed to reservations, if required.  That’s the whole upper deck of a Spirit.  And that, I believe, is new.  At one time, getting to the terminal half an hour early for a mid-day sailing would get you on.  People need to know that may well not work anymore.  More likely to need a reservation.  Noteworthy, that rte 1 traffic is down from July last year and August traffic likely will be down from last August.  And yet, the multi-sailing waits.   If nothing else, it will be good for revenue.  I’ve asked what’s happening, and am awaiting a response.

Questions, comments, don’t be shy.

Brian Hollingshead Co-Chair FACC


June 2018 Ferry Traffic

FACChairs,

BC Ferries Traffic Stats Download June_2018_Traffic_Stats

A bit of a departure from our dead boring, everything’s lovely comments of the past months.  Traffic is still up, 2.7%, passengers and 1.9%, vehicles (graph 1).  Dampened somewhat by a few head-scratchers this month.

Capture1

For instance . . .

– traffic, particularly vehicle traffic, substantially off on Routes 2 and 3, dragging down the Majors.  This is consistent through the four months of this fiscal year (graph 2).  Horseshoe Bay congestion a factor?  That can and will discourage discretionary traffic.  Coastal Inspiration being out of service?  Probably another factor.   Rte 30 is likely picking up some of lost Rte 2 traffic, but certainly not all of it.

Capture2

– passenger traffic stronger than vehicles on each of the Majors this month.  A summer trend?  Stay tuned.

– vehicle traffic up on both northern routes, while passenger traffic down on both routes.  Increases perhaps related to LNG activity in Kitimat?  If not this month, expect it to be a Rte 10 factor in coming months.

– Rte 9 up over 20%, but related to struggles keeping the Q/Nanaimo alive a year ago.  Was not a fun month for BCF or customers

Graphs 3 and 4 show June traffic in sustained growth country for both the System and for the Minors.  While the System and Minor route graphs look about the same, consider the actual numbers (why graphs alone aren’t always to be blindly trusted).

Capture3

Capture4

The System had lost 6.2% of its 2009 June passenger traffic and 9.1% of its June 2009 vehicle traffic by 2014, the darkest year. June passenger traffic is now restored to 9.3% over Jun 2009 levels, while vehicle traffic is up 8.5%.

June 2014 Minor route traffic had dropped by over 12%, compared to June 2009.  A deeper ditch than the System.  Yet June vehicle traffic is now up 8.6% over Jun 2009, while passenger traffic is up 5.9%.

Point being, the Minors took a much bigger hit than the System (read, the Majors), but have recovered, and are recovering at a faster rate than the big fellas.  As to why, that’s another story, as yet unwrit.  It’s likely the answers lie in a million details, specific to each of our routes.

The thirteen month graph (graph 5), reminds us that the system traffic is up, but not at the level we’ve come to expect over the past four years.  The Majors are the drag this year, doing ok but not at the stellar level of past years.  This is borne out by Graph 2, suggesting the Majors have been sluggish all this fiscal year.  The April bottom bounce, of course, was the result of the loss of half the Easter weekend to the previous month.

Capture5

Graph 6, the daily traffic picture, shows clearly that the Minors have experienced increasing traffic, essentially every month of the same month in the previous year.  While there are some ups and downs on specific routes, the overall  message is crystal clear.  The Minor routes are on a roll, and have been for the past four years.  A roll which shows no signs of abating.  The need for more capacity is emerging on more sailings, on more routes, every month.  This summer is going to be more than painful on an increasing number of routes/sailings.  As we’ve learned from experience, one and two sailing waits lead to visitors not coming back.  Daily traffic graphs for Rte 3, the North and the Majors are not as clear as this one.  Generally similar but mushier.

Capture6

Graph 7, traffic has come a long way in four years.  With the growth apparently softening with the Majors, the rate of increase could ease off a bit.  Will depend to a large degree on what happens this summer.

Capture7

Graph 8 has always seemed a bit weird, the split in direction in 1996 and 1997, passenger traffic increasing while vehicle traffic fell.  Double checked, and that’s the way it happened.  It was a time of rapidly (for then) rising fares, with locals storming the barricades, or at least the terminals.  The gov’t of the day brought in a wise person who recommended the discounted ‘ticket’ fares be rolled back, while the cash fares remain at their higher levels.  The move satisfied local residents, while it’s not so clear how visitors reacted to the fares of the day.  It was evidently a time of ‘let’s do it and see what happens’.

Capture8

So, what to expect . . .

While too early to see clearly what’s going on, it appears traffic growth on the Majors is settling down to a more modest pace.

Growth on the Minors remains strong and very likely will continue to do so through the summer.

Traffic on the Northern routes remains a crap shoot, dependent on weather, forest fires, as well as the usual, the Canadian buck, US politics, the price of gas.  Sadly, it will not receive the hoped for boost from Rte 28, the new route (reincarnation of Rte 40, cut in 2014) to serve Bella Coola to Port Hardy.  The service will not make it into operation this summer.

The 15% fare cut was expected to generate a traffic boost.  It could partly explain the Minors traffic energy while the lack of a fare cut on the Majors could account for their relatively lack lustre performance.

It’s all a big wonderful world with enough moving parts to keep us all engaged for a lifetime.

With that ominous note, I leave it to you for questions, comments, inspirational and inspired contributions.

Brian

March 2018 Traffic

FAC Chairs

You shall be comforted, knowing the world is unfolding as it ought to.  At least for ferry traffic.
Vehicle traffic is up over last March by 4.71%, passenger traffic, 5.20%.  Simply rounded, traffic for March is up 5%.  While boosted by half an Easter weekend that wasn’t enjoyed in March 2017, still a darn solid increase.

March_2018_Traffic_Stats download
Given this is the end of the fiscal year, the Year to Date numbers become more significant. Vehicle traffic has increased over FY2017 by 5.03%, with passenger traffic up 4.73%.  Again, 5%.  To the even bigger, more significant, picture this is the third year in a row with these striking traffic increases.  Good for BCF bottom line.  Good for local businesses. Getting crunchy for overloads on some routes.
Into the murky details . . .
The overall March traffic increase was supported by good news from all route groups (graph 1) and from almost every route.  The March results were consistent with those for the Year to Date data (graph 2), an accountant’s dream.

Capture

Capture2

Graphs 3 and 4 indicate March traffic, like that of most months this past year, has lurched along to the highest levels we’ve seen for both the system and for the Minor routes since 2010, the year these detailed stats first became available to us.

Capture3

Capture4

Graph 5 gives us the past year, month by month.  Generally strong, particularly in the big money months, June to September.  It seems there will always be a few unhappy surprises (May, Nov).  Sometimes it’s weather.  And sometimes it’s just those capricious stars aligning to thwart the best efforts (and wishes) of BCF.

Capture5
While traffic has enjoyed three feastish years, we need to remember it’s digging itself out of the ditch created by seven faminish years (graph 6).  Still well below what it might have been, had the drama been avoided.  Editor’s note . . .the broken line for vehicle traffic is because these are AEQ numbers, projected from the actual numbers provided by the monthly updates.  Passengers show as a solid line as there is only just the actual count.  No such thing as ‘equivalent’ passengers.  Mercifully.

Capture6
Graphs 7 and 8 illustrate the strong growth of the past three years, as well as the ditch time, for each our three coastal community route groups.  Rte 3, nominally a Major route, is included as they shared the hard times (fare increases, service cuts) endured by the Minor and Northern routes.  The Northern traffic collapse in 2007 was, of course, the result of the tragic loss of the Queen of the North (our ultimate reminder to never take safety for granted).

Capture8

Capture8a
The final message from GraphLand, number 9, the rock and roll history of ferry traffic since 1990.  More a picture of political ideology than customer demand.  Has always been the case and probably always will be.

Capture9

So here we are on the doorstep of a brand new year.   What’s coming  . . .
If you can believe the trend lines – some risk but better than throwing darts at a spreadsheet – experience would make the case for the current trend to continue. This, in the absence of any cataclysmic change in the fundamentals (Canadian dollar collapse, massive fare increase, economic meltdown, etc.).  Throw in the 15% fare cuts, the return of free seniors’ travel and traffic is certain to see even more dramatic increases.  It’s noteworthy that Minor Route traffic increased significantly more than on the Majors.   Ding!   Increased capacity needed in the hot spots, and the coming hot spots, sooner than the normal course of events would entail.  Possible responses schedule tuning, vessel redeployment, larger replacement vessels and hopefully tightening up the current four year cycle to put new boats into service,  BCF and the Province seem to be aware of the present and coming problems.  Now for the response . . . .It’s become urgent.
Anyway, an interesting year to come.  Comments always welcome!

Brian

January 2018 Ferry Traffic Stats

FACChairs,

It seems we’re witnessing a new normal with the 4.5% vehicle traffic increase over Jan 2017, and 3.3% passenger step-up.  These jumps are noteworthy in and of themselves, but are particularly so, given the  weather we endured this past Jan.  That sort of weather typically discourages anything but the most necessary ferry travel.
As we found with most months this past year, traffic is  generally up, in the 4% to 6% range.  Always, the occasional contrarian route. But not many.  Graph 1.  The year-to-date stats, (graph 2) are solid and will remain so for the rest of the fiscal year (to Mar 31).
Graph 1
Untitled2
Graphs 3 and 4, show the longer look at Jan traffic for the system and for the Minors is consistent with what we’ve been watching all year, continuation of a three year strong upward trend.  This Jan, passenger traffic growth didn’t keep up with vehicle increases.  Maybe a concession to our rain-soaked weather?
Untitled3
Untitled4
Graph 5 is a picture of the past year’s traffic.  May and Jun bucked the trend, but overall, a solid year.
Untitled5
Graph 6 presents three messages and a warning . . .
Untitled6
1. We went through seven challenging years when steep fare increases and fuel surcharges were the order of the day. Traffic (and our communities) paid the price.  While there were other factors, it’s our belief that fares were the principal traffic-depressing factor.
2. Traffic has been on a roll for the past three years and it looks like the it’s going to keep rolling that way, barring any dramatic changes in the economy, the value of the dollar or cataclysmic world events.  The 15% fare cuts and the return of the free seniors’ fares will stimulate a traffic boost, while the fare freeze on the majors will support continued growth.
3  As strong as the traffic growth is, it’s still a long way below where we believe it would have been with even gradual growth resulting from modest fare increases (rate of inflation) since 2003.
4. Ferry traffic is approaching uncharted waters, in terms of BCF’s capacity to accommodate the emerging demand on our routes.  In the short term, we are going to see more routes, with more sailings, experiencing overloads where they never used to exist.  BCF will have some limited means of increasing capacity through schedule tweaking.  In other cases, that option is tapped out, and vessel capacity will need to be rethought, meaning larger than like-for-like replacements, two-for-one replacements, redeploying ferries to less demanding routes and accelerating some vessel retirements where the existing ones are no longer up to the job.  These are longer term strategies – maybe three to four years – and will be dependent on available funding.  The alternative is watching the service of which we’re so proud gradually come undone.  This is not a new discussion.  Nor is it going away any time soon.
Graphs 7 and 8 are reminders that all three of our route groups are seeing the same growth projections.  Rte 3 is one of ‘our’ route groups, as it experienced the same fare increases and service debilitating decisions that the rest of us did.
Untitled7
Untitled8
Graph 9?  Back to the uncharted waters comment.
Untitled9
Brian

Performance Term 4: An Opportunity to Reset Ferry Fares

Background:

The British Columbia Ferry Corporation was established in 1958 through the Toll Highways and Bridges Authority. It was a government Crown Corporation to provide public ownership of transportation routes previously serviced by the Canadian Pacific Railway and the private carrier Blackball Ferries.

The government of Premier WAC Bennett established the service in part as a response to labour unrest that led to job action. He declared that a reliable and affordable connection between Vancouver and Victoria constituted an essential service because British Columbians have a right to uninterrupted and affordable transportation services to their communities. Premier WAC Bennett knew that if the provincial economy was to grow that the communities of British Columbia needed to be connected by road, and in the case of coastal communities by ferries, which like bridges and tunnels extended the highway by overcoming natural barriers to the movement of goods, services and people.

In 1961, the Toll Highways and Bridges Authority made the decision to expand the ferry service and purchased the Blackball Ferry Company for $6.6 million dollars integrating it as a part of the BC Ferry Service. This was done to expand government-funded marine transportation service from the original Tsawwassen to Swartz Bay route to include service from Horseshoe Bay to Gibsons (Langdale) and to Nanaimo.

On January 1st, 1977 BC Ferries was formed as a government-sanctioned monopoly Crown Corporation to operate the coastal ferry service that was initiated by the Province in 1960. The mandate of the original contract with BC Ferries reads:

The coastal ferry system is integral to economic growth and development in British Columbia, and getting people and goods to their destinations safely, efficiently and on time is essential if British Columbia is to be competitive in the world economy in which it operates.
And
BC Ferries is an integral part of British Columbia’s coastal ferry system, linking Vancouver Island to the mainland of British Columbia and linking many other coastal communities.

In the mid-1980s BC Ferries took over the saltwater branch of the Ministry of Transportation and Highways which ran K-class ferries to service small coastal island communities like Thetis and Penelakut. These privately contracted services administered by the Marine Branch of the Ministry of Highways and Infrastructure provided additional services across the Fraser River, and in the interior of the province.


Route 20 History:

BC Ferries Route 20 services Thetis and Penelakut Islands. Thetis Island has a permanent population of 350 folks that swells to close to 1000 in the summer months with vacationers and the summer camps for children and teens. Penelakut Island is a First Nation’s community that has a permanent population of approximately 450 members.

Ferry service to Thetis Island and later to Penelakut Island (called Kuper at the time) was the result of an agreement in 1958 by then Transportation Minister Phil Gaglardi and Adam Hunter, a third generation Thetis Island resident. Adam would build a road to Pilkey Point from Clam Bay, a distance of 4 km, and develop 60 building lots in exchange for the ferry. The construction of the road and side roads, which included significant drilling and blasting to get over Moore Hill, was done solely at Adam’s expense. This agreement was further evidence of the commitment of the BC Government to grow the provincial economy through remote community development. In other words the agreement was Thetis Islanders, you build the road and we, the government will provide ferry service at a reasonable cost.

The inaugural ferry run was on March 17, 1959, when the 6 car ferry, the MV Ethel Hunter started service to Thetis Island (see photo below). Service to Penelakut Island began for passengers in 1963, and included vehicles in 1975.

Untitled1

The cost of the sailing was set by calculating the gas tax that was lost to the province on that 6 km crossing had it been a highway. This was 50 cents one way per vehicle and 12

cents one way per passenger. The setting of the fare structure was part of the governments’ commitment to provide safe, efficient and timely service to the residents of Thetis and Penelakut Islands. Fares stayed at this level for many years. However by 1987 cash fares had risen to $7.80 for car and driver return.

Recent History:

In December of 2002 the then Minister of Transportation (MoT), Judith Reid introduced a new ferries model. According to the MoT news release the revitalized ferry system would result in; improved service and customer choice, guaranteed service levels and fair rates, and economic development and job creation.

Residents and business owners of Thetis and Penelakut Islands were encouraged with the Minister’s 2002 announcement for a ‘new’ ferries model. The promise of economic development and fair rates offered hope for a healthy future for our two ferry dependent communities.

However, the structure that was set up by the government created extreme financial and operational difficulties for BC Ferries and resulting undue hardship for residents and businesses of coastal communities. Basically the government who used to own controlling interest in BC Ferries, which had a book value of $503 million, divested itself of this interest. On April 2nd, 2003, the government issued BC Ferries a debenture for $427.7 million, which BC Ferries promised to pay in cash. The government was issued 75,477 non-voting preferred shares in BC Ferries valued at $1000 per share. On May 27th, 2004, BC Ferries paid the debenture of $427.7 million plus $25 million in interest to the government. This left the BC government with a minor $76 million stake in one of the largest ferry companies in the world. The resulting stagnant funding ($144 million per year in contract service fees) from government and the need to build and replace ships and upgrade terminals, left BC Ferries no choice but to put this burden on ferry users by continually raising fares (the beginning of the governments user pay policy). Within a year of the ‘new’ ferries model announcement, fares began to outstrip CPI growth by more than double on Route 20 (see graph 1). Additionally, overheated fuel costs along with the other operating, capital and overhead expenses drove Route 20 fares up 144%, from 2003 to 2015. This was in contrast to a BC CPI increase of 16% up to the end of 2014.

As fares rose on Route 20 inevitably traffic began to decline. Reduced tourist traffic, less commercial traffic and residential traffic had real estate sales dry up and caused businesses, summer camps and B&B’s to close their doors.

Untitled2

Current Situation:

As has been stated over and over again – in the Commission report and through the governments ‘engagement’ processes of 2012 and 2013 – the ever-increasing fare level is the primary cause of declining traffic, and related shrinking of our island economies. There can be no question the two are directly related. Moreover, residents of Penelakut Island suffer an additional burden. With high unemployment and reliance on social assistance many band members can not afford to load up an Experience card (minimum buy in is $115), so they pay primarily cash fares which are 30% higher. The Experience card system disproportionately disadvantages low income individuals and families, many of whom do not have a credit card or the cash to load the card. This is a real and daily hardship for these customers that are least able to cope with fares that have long since passed the tipping point of affordability.

The 1.9% preliminary fare cap, while barely approaching the inflation rate, was a welcome departure from earlier fare caps. But like a river overflowing its banks, the rate of increase becomes secondary to the absolute level. The economy of the gulf islands has contracted substantially as a result of ferry fare levels, particularly in the last six or so years. There is no shortage of evidence. We know from the substantial, sustained traffic increases that resulted from removal of the over-height premiums that traffic will respond to significant fare reductions.

Recommendation:

Route 20 Ferry Advisory Committee, on behalf of the residents and businesses of our two communities recommend that in the interests of beginning to restore economic stability and reduce the very real financial hardship to the ferry-dependent coastal communities, that fares on the Minor Routes be reset with a 25% rollback effective April 1st, 2016. This could be achieved through some combination of additional government funding, further BCF efficiencies and service reductions on the 3 Major Routes. We would then expect to see subsequent fare increases in the order of CPI increases in the following years. Such an adjustment would fall, we believe, within the context of balancing the interests of the users and the ferry dependent communities with those of BC Ferries and the Province.

The Province has long since broken its commitment to residents of Route 20 for affordable ferry service. The province alone can reverse the economic decline of all coastal communities. Please, let’s not lose this once-every-four-years opportunity.

Sources:

British Columbia Ferry Corporation and Fiscal Fairness for Ferry-Dependent Communities January 2013. Report prepared by Maradadi Pacific Holdings Ltd.
PT4 Fares, Economies and Sustainability, submitted by the Ferry Advisory Committee Chairs, May, 2015
PT4, Time to Reset Ferry Fares?, submitted by the Southern Gulf Islands Ferry Advisory Committee, April, 2015

PT4 Fares, Economies and Sustainability

The Fare Cap

MAY 21, 2015 – The Ferry Advisory Committee chairs were pleased, and surprised, with the announcement of the 1.9% preliminary fare cap. Surprised, because with a nominal 2% inflationary increase in expenses, and the substantial capital program, we were expecting a much higher cap. Given the ground rules – existing service levels and assumed continuance of FY2016 service fee – we realize getting to a 1.9% fare cap was a major achievement. Any further reduction that might be considered between April and June would require additional accommodation.

Sustainability

Sustainability, the term, is borrowed from environmental science referring to ‘endurance of systems and processes’. We hear it referred to in terms of sustainability of the coastal ferry service, as if BC Ferries is in danger of no longer ‘enduring’. This seems to us like wondering if UBC or BC Transit or VGH or the Coquihalla Highway will ‘endure’. In fact, we believe that all four of those, as well as BC Ferries, will (and must) endure, hopefully in good health. That good health will depend primarily on adequate funding from governments and ‘customers’. All five are vital elements of the broad community infrastructure. The demise of any is inconceivable.

We are more concerned with the economic sustainability of the ferry-dependent communities served by the Minor and Northern routes, and Route 3. The ferry service is the economic life-line for these communities.

Continue reading

A good start – A long, long way to go

20 MARCH 2015 – Chairs of BC’s Ferry Advisory Committees are encouraged by the newly announced 1.9% cap on annual average fare hikes starting in 2016. But they say the small increase fails to address the fundamental problem: the cripplingly high existing fares.

The unavoidable comparison is to the hypothetical camel with the breaking back. The camel has been loaded with 50-pound bales of straw. When the breaking point is reached, there’s little joy in reducing the weight of the next bale to only 10 pounds. The 1.9% increase is that 10-pound bale of straw.

As with the camel, the ferry users’ problem is the burden that preceded the 1.9% increases. It needs to be addressed.

The extraordinary fare increases of the past decade have resulted in traffic collapsing to its lowest level since 1990. The decline in traffic, particularly since 2008, has resulted in a parallel withering of the economic and social vitality of coastal ferry dependent communities. Ferries are the lifeline service for people and for businesses. There is no alternative.

“We watched traffic fall away as fares escalated for the past decade. Our experience tells us that ferry traffic and coastal communities will not and cannot recover until the excessive fare burden is removed,” says Brian Hollingshead, chair of the Southern Gulf Islands FAC. “This means a fare roll-back, not a modest increase.”

If the Province is serious about the economic sustainability of dozens of coastal communities, it’s time to assess the past and future impact on these communities of the current ferry fare regime.

We recognize that fares and funding need to strike a reasonable balance between the interests of the Provincial treasury, BC Ferries and ferry users. “Yet ferry users, who contribute more than half a billion dollars a year in fares, have paid far too high a price,” says Keith Rush of Thetis-Penelakut FAC. “It’s time the load was redistributed to provide some relief for those users who have seen their fares rise as much as 120% in an 18%-inflation period.”

The Commission report shows ferry users are presently paying 100% of BC Ferries operating costs. That’s higher – much higher – than in comparable ferry systems, including Washington State Ferries and Marine Atlantic Ferries, cited in the Commissioner’s Efficiency Review.

We are at a critical juncture. We ask the Government to consider rebalancing the equation by means of a sufficient funding increase to provide a significant fare roll-back. It’s fair, it’s vital.

Contacts

Latest fare hikes just prolong ferry troubles

31 MARCH 2014 – Ferry fares continue their relentless climb into regions of unaffordability, accompanied by repetitive rhetoric from the provincial government that is disconnected from acceptance, or even understanding, of the needs of BC’s coastal region.

With the fare increases taking effect on April 1 and fuel surcharges imposed in January, most passenger fares are up 8.4 percent and vehicle fares are up 7.4 percent over last year, yet another round of fare hikes far above inflation. And seniors now have to pay for travel from Monday to Thursday.

On those northern routes that will continue to operate, fares are up only 1.5 percent, but the fare break is too little, too late. On the northern route due for outright elimination, Route 40 serving the central coast, fares increased 60 percent and traffic dropped 43 percent in a straight line since 2007, under operating conditions that ran counter to local residents’ suggestions to improve the route’s efficiency. Now it’s considered unprofitable, and treated as unsalvageable, regardless of the damage that will result to local communities and BC’s tourism industry.

Continue reading

Ferry cuts: The sweet spot

REVISED: See bold in table in this post and in background link.

5 DECEMBER 2013 – While the Ferry Advisory Committee Chairs have not yet succeeded in figuring out how the provincial government’s ferry cuts will safeguard the coastal ferry system, they do think they’ve found the sweet spot for the least painful possible service cuts.

“If the government’s goal is to find the biggest savings for the smallest traffic loss and least hardship, then we suggest it looks harder at the major routes, and at the big money-losing route hiding behind the profit-makers,” says Brian Hollingshead of the Southern Gulf Islands.

The three major routes (from the Lower Mainland to Vancouver Island) are the giants of the system. Yet they’re facing the slimmest of cuts compared to the 22 smaller routes. Continue reading